Table of Contents
Market Overview
Key Index Charts
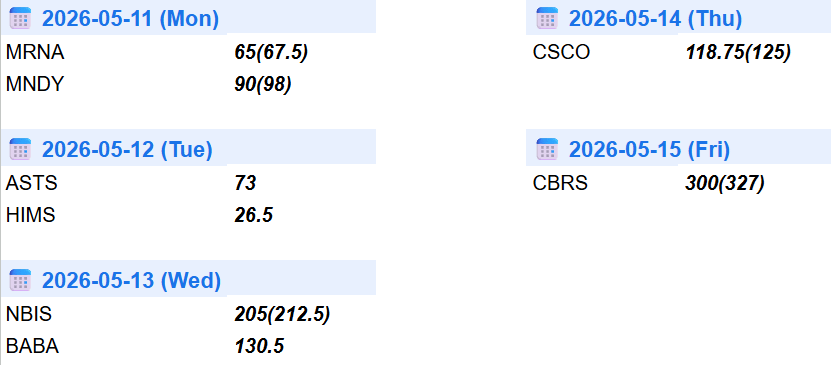
Earnings & Interesting Movers Recap: MNDY, CRCL, ASTS, HIMS, NBIS, BABA, CSCO and CBRS
Earnings to Watch This Week: BIDU, HD, ADI, NVDA, INTU, DE, WMT and WDAY
1. Market Overview
Cherry-picking is one of those funny expressions that somehow survived both finance and grocery stores at the same time. Everybody wants the perfect cherry. Nobody wants to talk about the rotten ones sitting underneath. Markets work the same way. When the tape keeps grinding higher, people start selecting only the narratives that justify even higher prices while conveniently ignoring everything else. Maybe that’s why Nvidia now sits in such a weird spot heading into the earnings season finale. Is it just another cherry on top of the AI trade, or are investors already busy cherry-picking the top itself?
The rally following Trump’s “Iran war is over” comments was another good example. The war apparently forgot to end, but markets still ripped like somebody activated a giant risk-on cheat code. CTA flows, trapped bears, positioning squeezes, momentum chasing, probably all of the above. The exact explanation almost does not matter anymore because modern markets have become highly reflexive machines. Once enough money starts moving in the same direction, the narrative usually arrives afterward to justify it retroactively.
Now the same tape suddenly looks a lot less comfortable. Trump returned from China without much clarity around Taiwan, while also signaling little appetite for getting dragged into another distant conflict over the island. Meanwhile South Korea’s market slammed into fresh highs before suffering a violent reversal, while Samsung strike headlines added even more stress across semis and the broader supply chain. Japan continues fighting inflation, currency pressure, and rising yields all at once, with long-dated JGB yields recently pushing toward multi-decade highs. Global bond markets increasingly look like they are held together by confidence alone, while U.S. banks are still quietly sitting on massive unrealized losses parked inside hold-to-maturity accounting limbo. Underneath the headline indices, market breadth has also started deteriorating noticeably, with leadership narrowing almost entirely toward mega-cap and AI-linked names.
And yes, the “Sell.” note was partially a joke toward Michael Burry famous tweet.

Partially. But the important part was never the tweet itself. It was the reaction.
A couple editions ago I mentioned that “bulls look invulnerable, though we know what their kryptonite looks like. It starts with a capital A and reads as alignment.” Both SPY and QQQ slightly frontran several key resistance areas built mostly around weekly TRLs and measured move extensions, while semiconductor leadership itself started looking increasingly unstable beneath the surface. Personally I prefer fakeups and undercuts. They tend to clean positioning better. But when sellers become too impatient and start stepping in early, it usually tells you something.
Greed turns into fear much faster than fear turns into greed.
The difficult part is figuring out whether this is the start of something bigger or just another pullback that gets absorbed like every other dip over the last two years. Maybe Nvidia clears everything again and the AI trade goes another 100% higher straight into glorious returns on all that capex spending. Or maybe not. Nobody knows.
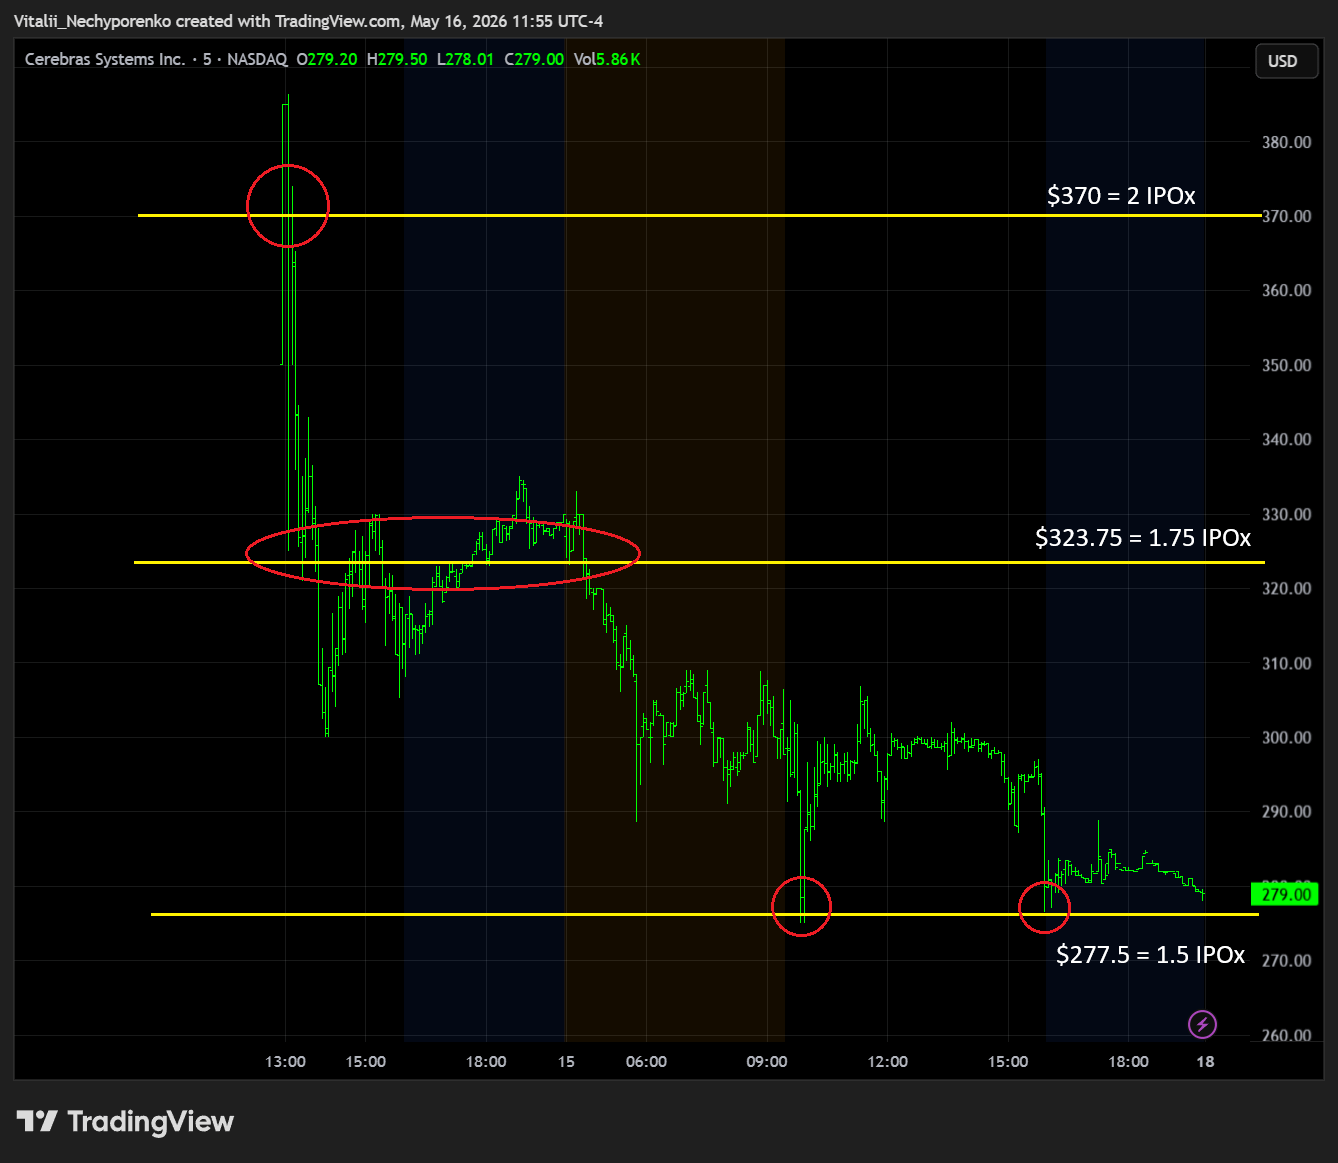
“One thing that definitely did not behave like the financial media victory lap suggested was the CBRS IPO. The appetite for AI exposure still looks insatiable, though the actual tape increasingly resembles a market where everyone is trying to squeeze through the same exit at once. “Highly successful” depends entirely on who you ask. For insiders, underwriters, and people lucky enough to receive proper allocations, maybe yes. For everyone else chasing an opening print flying straight into orbit before immediately reversing, the experience looked slightly different. Every IPO enters the market carrying one important anchor point - the IPO price itself. That is where IPO extensions come from, and why they often matter far more than random century marks people love drawing on charts. The trick is figuring out which extensions the market actually respects. Sometimes it is 0.25 increments on newer listings. Sometimes 1000x extensions that old-school traders still monitor decades later. Markets are weird like that.
Earnings season is mostly over now, with Nvidia sitting there as the final cherry on top. CSP strikes have already been updated, though this still does not look like the greatest environment for aggressive put selling.

If Friday’s tape continues, premiums and psychology can change very quickly. Markets spent most of this year rewarding every dip buyer almost instantly. The moment that reflex stops working, sentiment tends to reprice much faster than people expect. Meanwhile just follow the tape, do not fight the steamroller, and mind your stops. No matter how high markets can go, it means very little if you cannot protect the capital you are supposed to compound with.
2. Key Index Charts
In this section I highlight only the most important zones with brief comments. I use fully layered charts to identify them, but keep the charts here clean for clarity.
Given how crypto trades over the weekend, odds currently favor a Big and Beautiful gap down on Monday. That said, a lot can change in this market very quickly, so there is little point in frontrunning it. Let’s see where futures point on Sunday night.
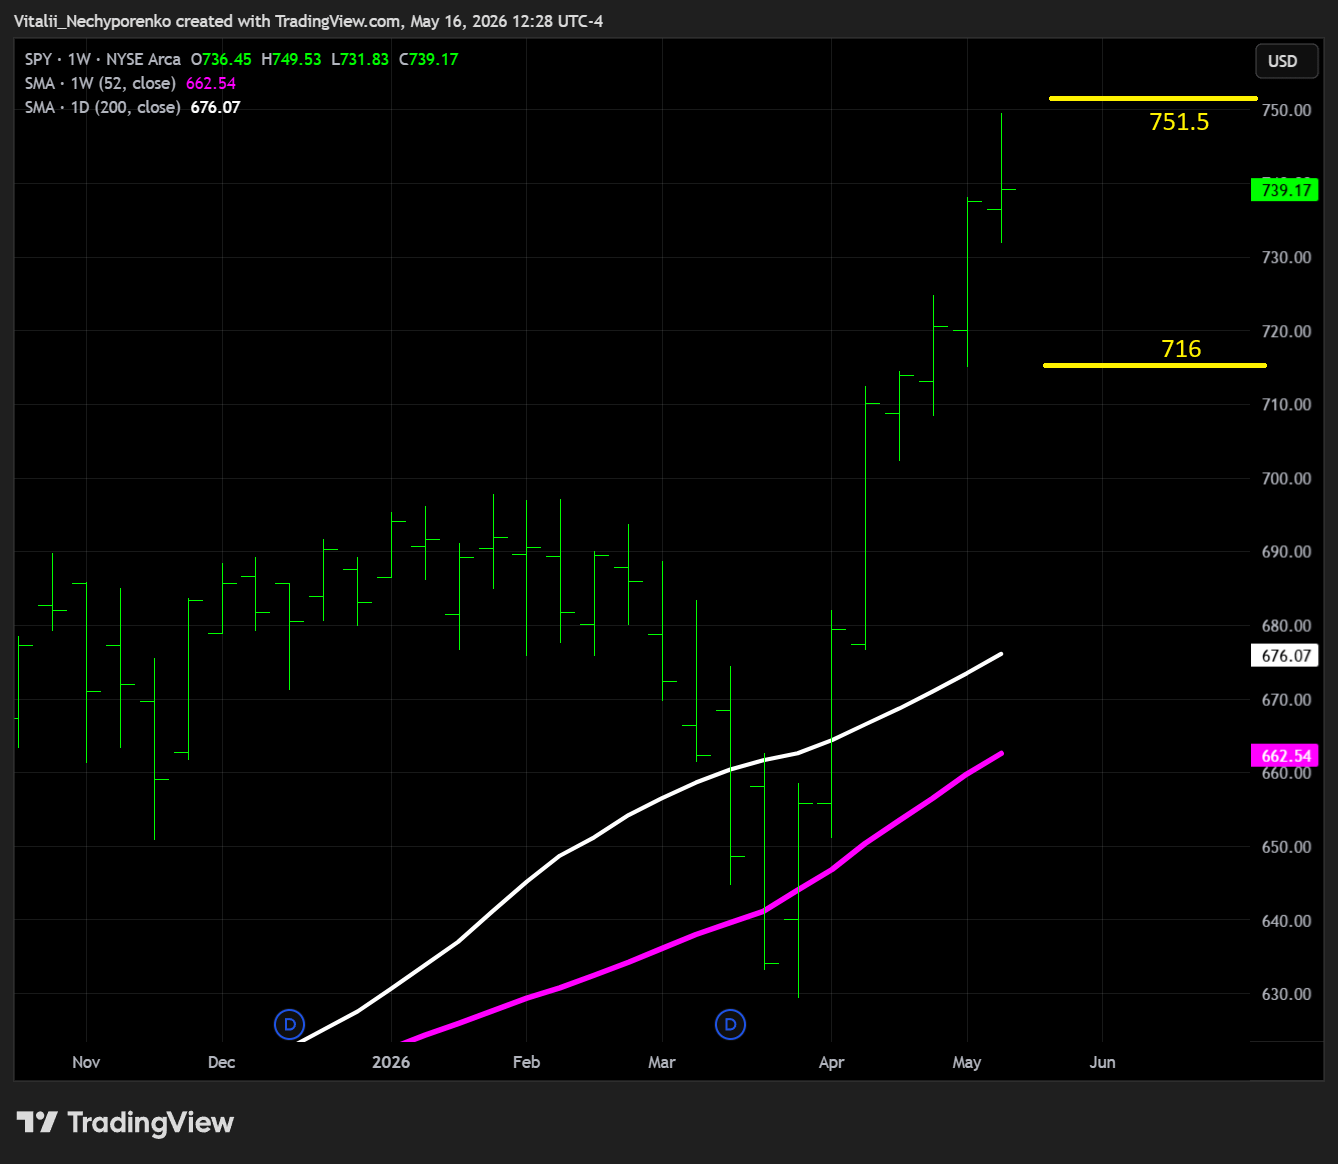
SPY
The S&P 500 ETF frontran the mentioned key resistance area by a couple of dollars, and it still remains intact at 751.5. The same goes for support at 716, though there is a fast zone sitting right below it for obvious reasons. Let’s see if bulls can defend the area.
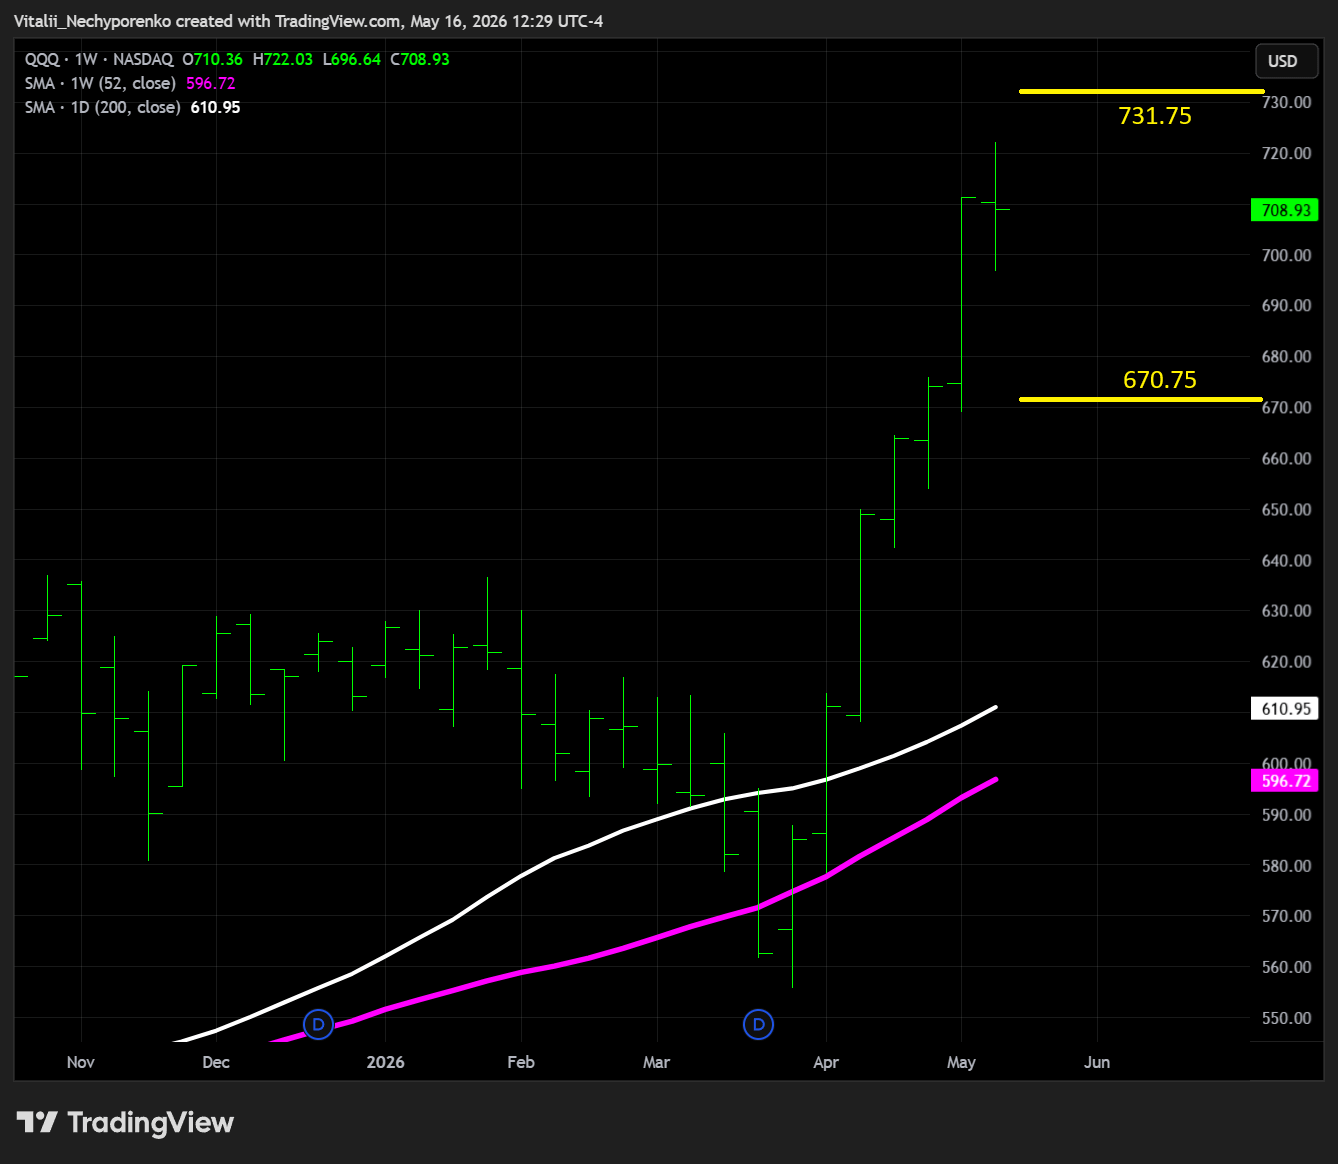
QQQ
The Nasdaq 100 ETF follows a similar pattern, though key resistance shifts higher toward 731.75 alongside the weekly TRL angle, while key support also moves slightly higher to 670.75. Yeap, that’s nearly 6% below Friday’s close, but let’s not forget how we got here in the first place.
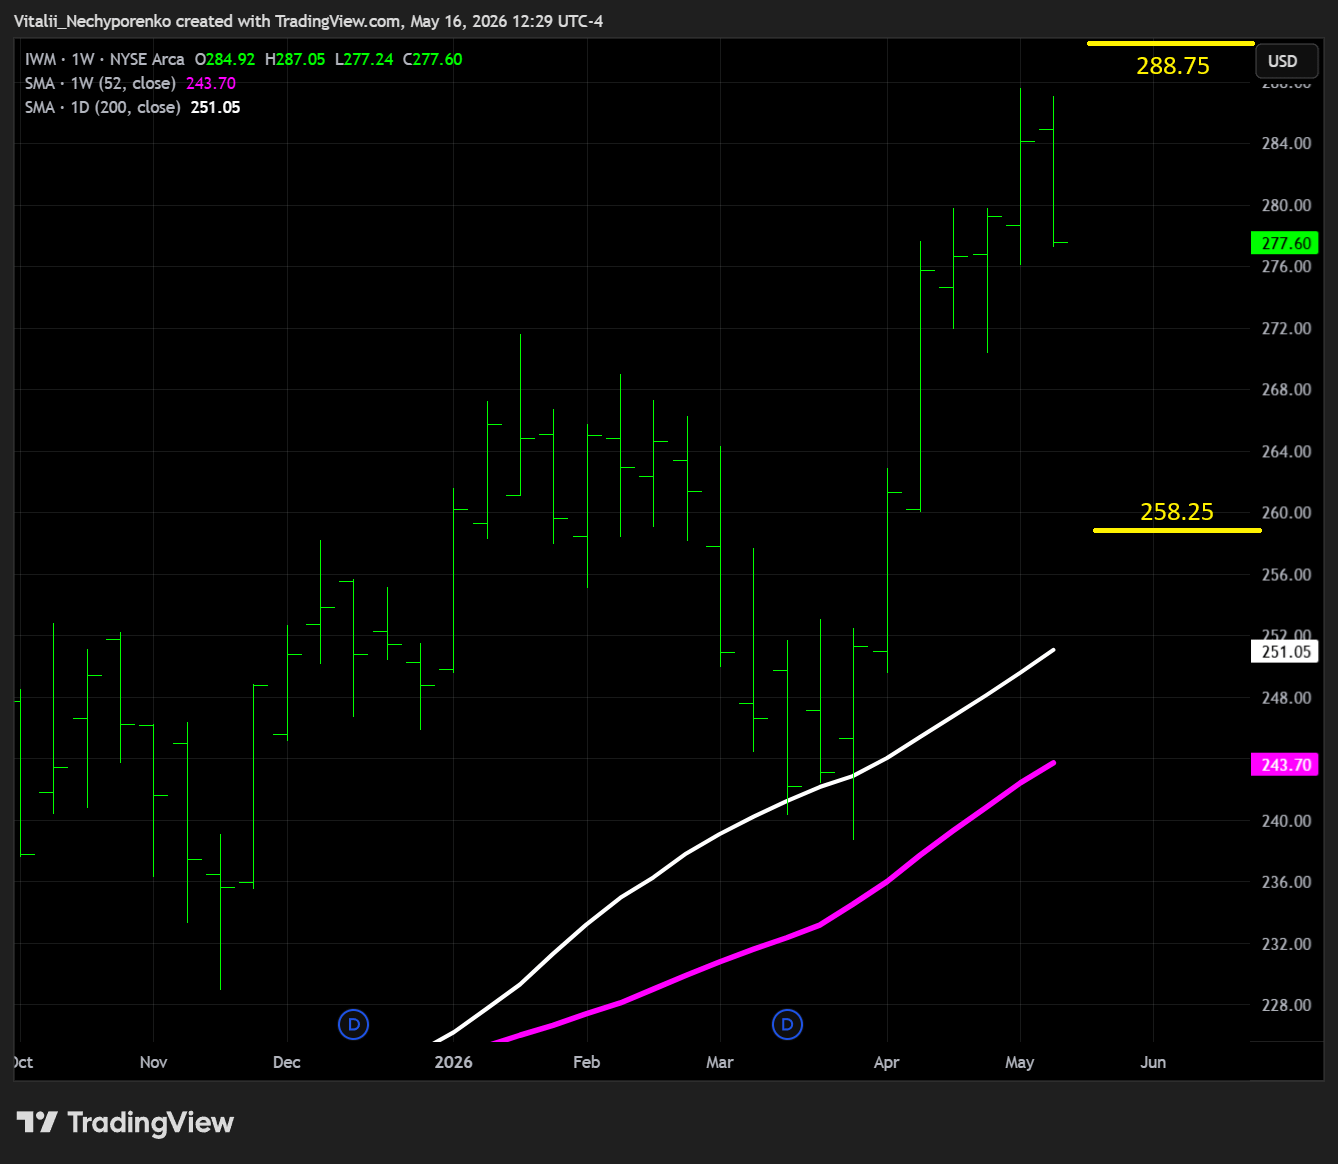
IWM
The Russell 2000 ETF underperforms, which is not surprising given how rate-sensitive the index is. Key resistance shifts to 288.75, while key support sits at 258.25, and even if the area holds, a potential test there does not look particularly pretty.
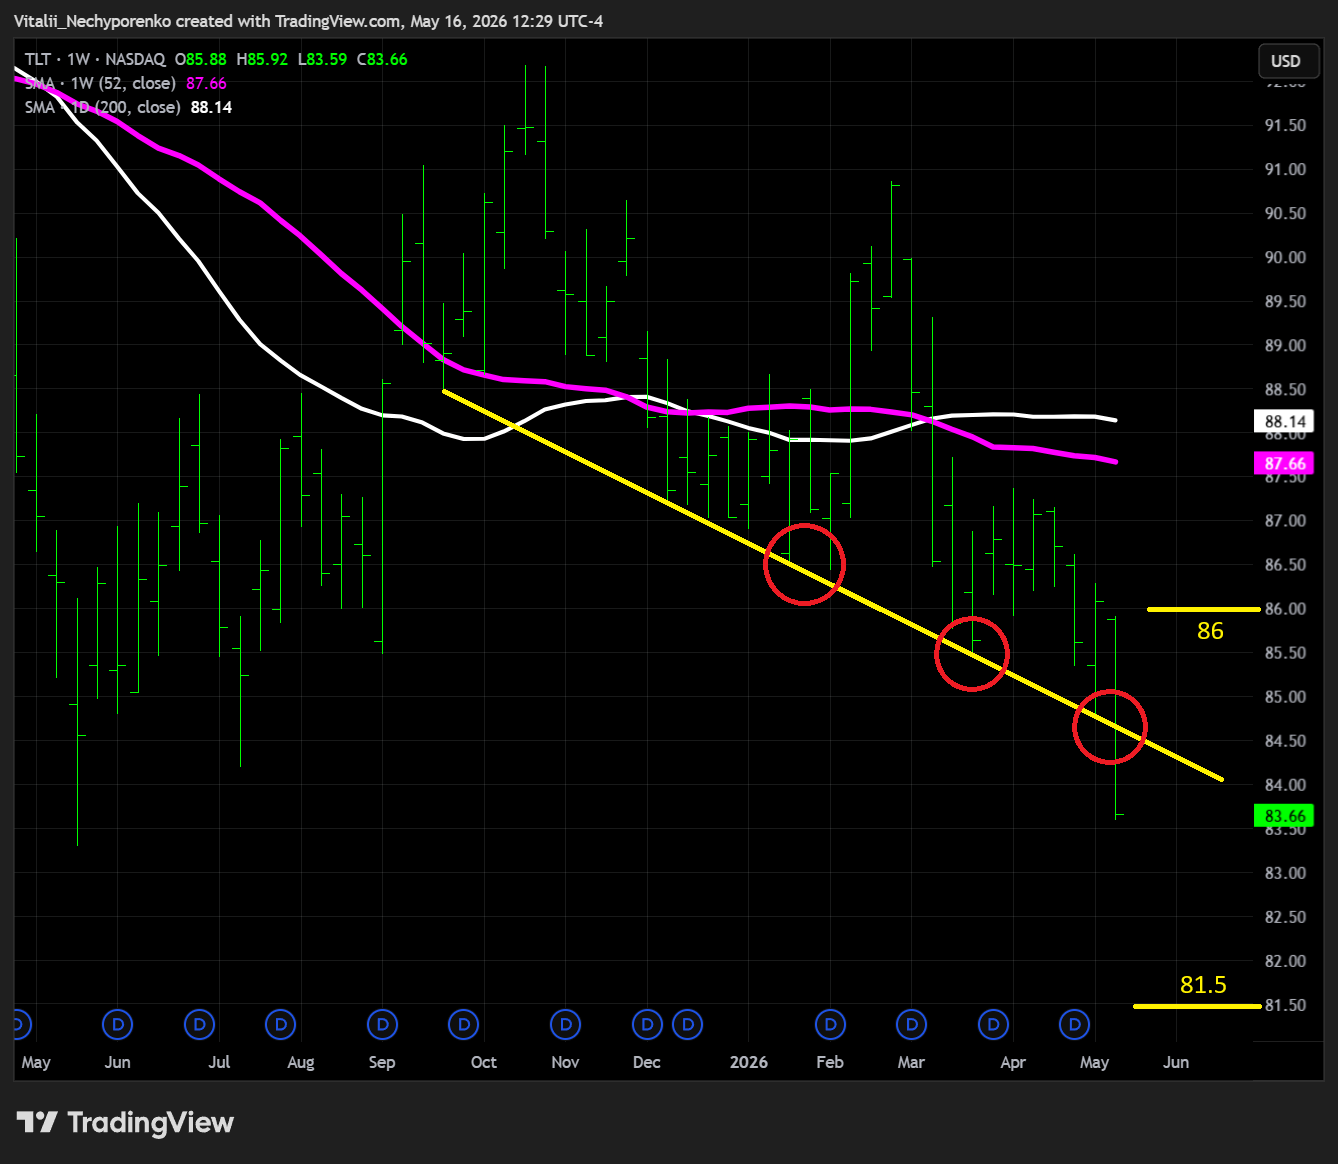
TLT
Did somebody say “rates”? The 20+ Year Treasury Bond ETF finally lost the key BSL that really tied the room together. Next support sits at 81.5, while key resistance shifts to 86.
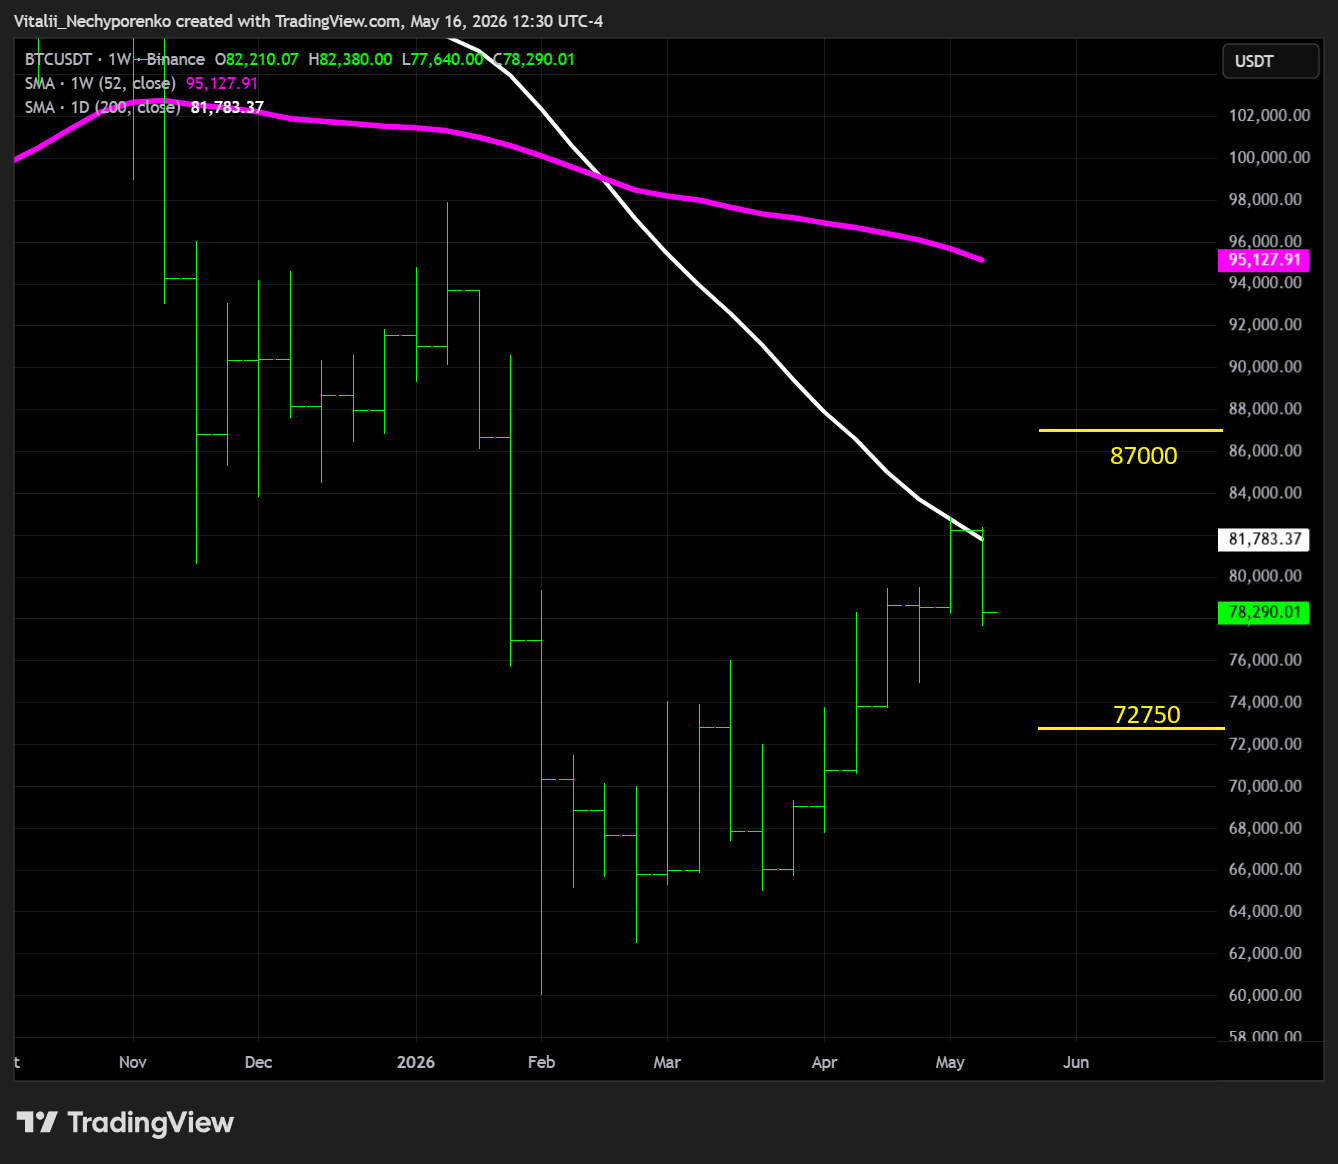
BTC
Bitcoin did not like the 200d, though this time it might not entirely be its fault. Key support shifts slightly higher to 72750, while key resistance moves slightly lower to 87000.
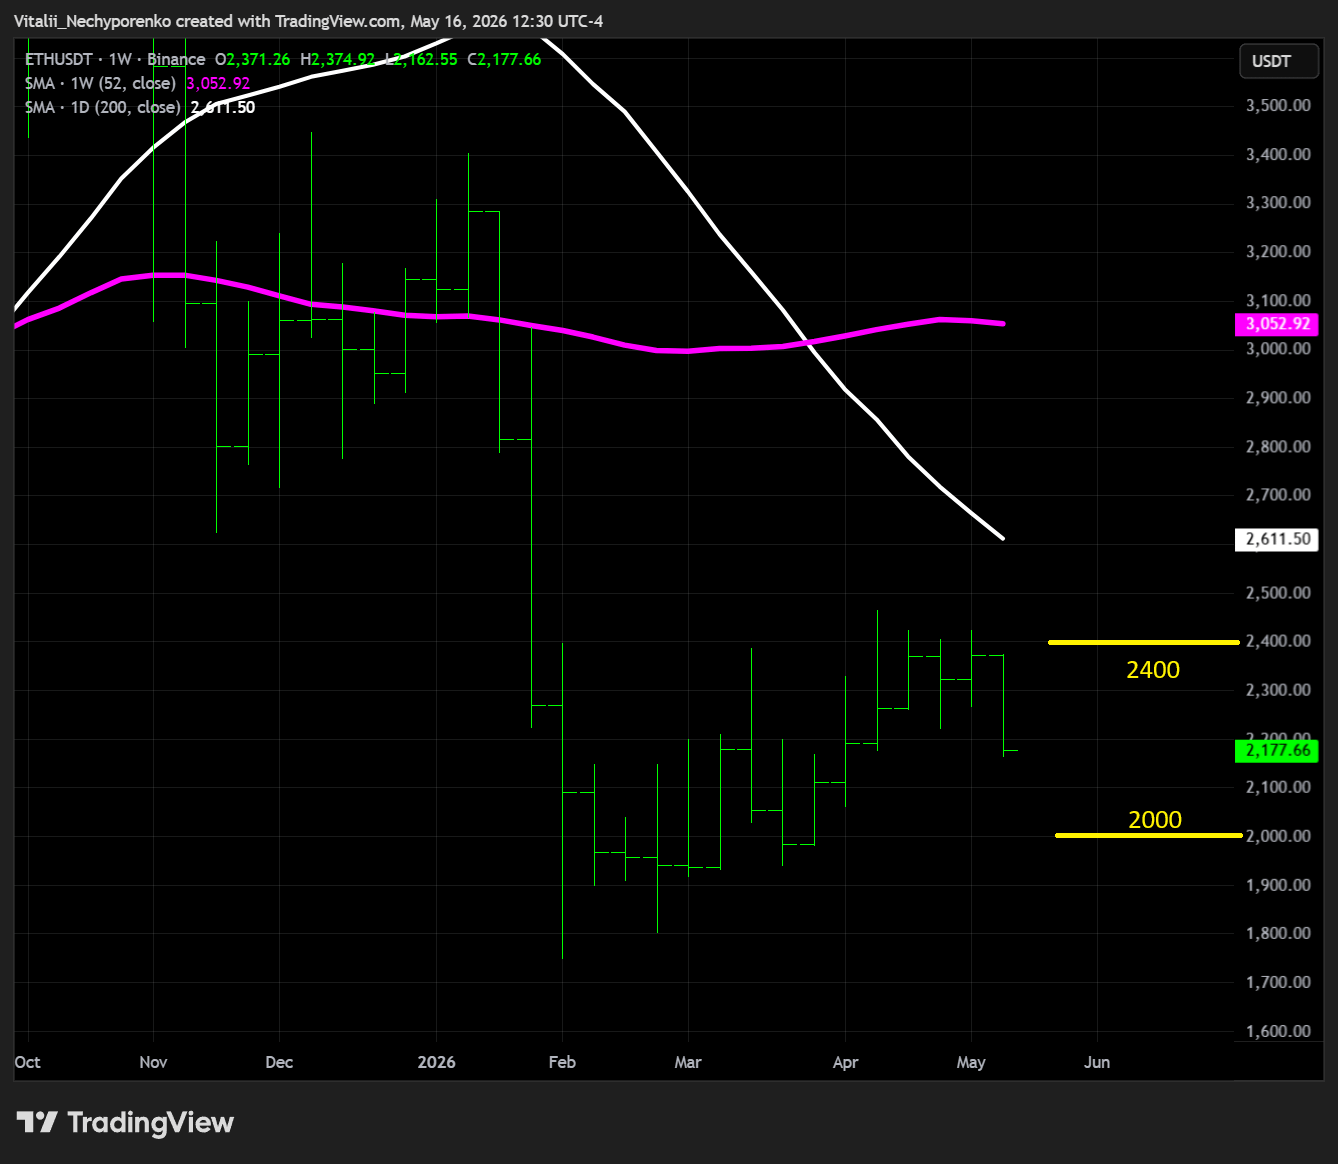
ETH
Ethereum continues to underperform, flirting with the 2150 area mentioned last week. Key resistance now shifts to 2400, which also sounds familiar, while key support moves down to 2000. And it better hold.
3. Earnings & Interesting Movers Recap
Below are snapshots from the Price Action Playbook: Research dump for the week
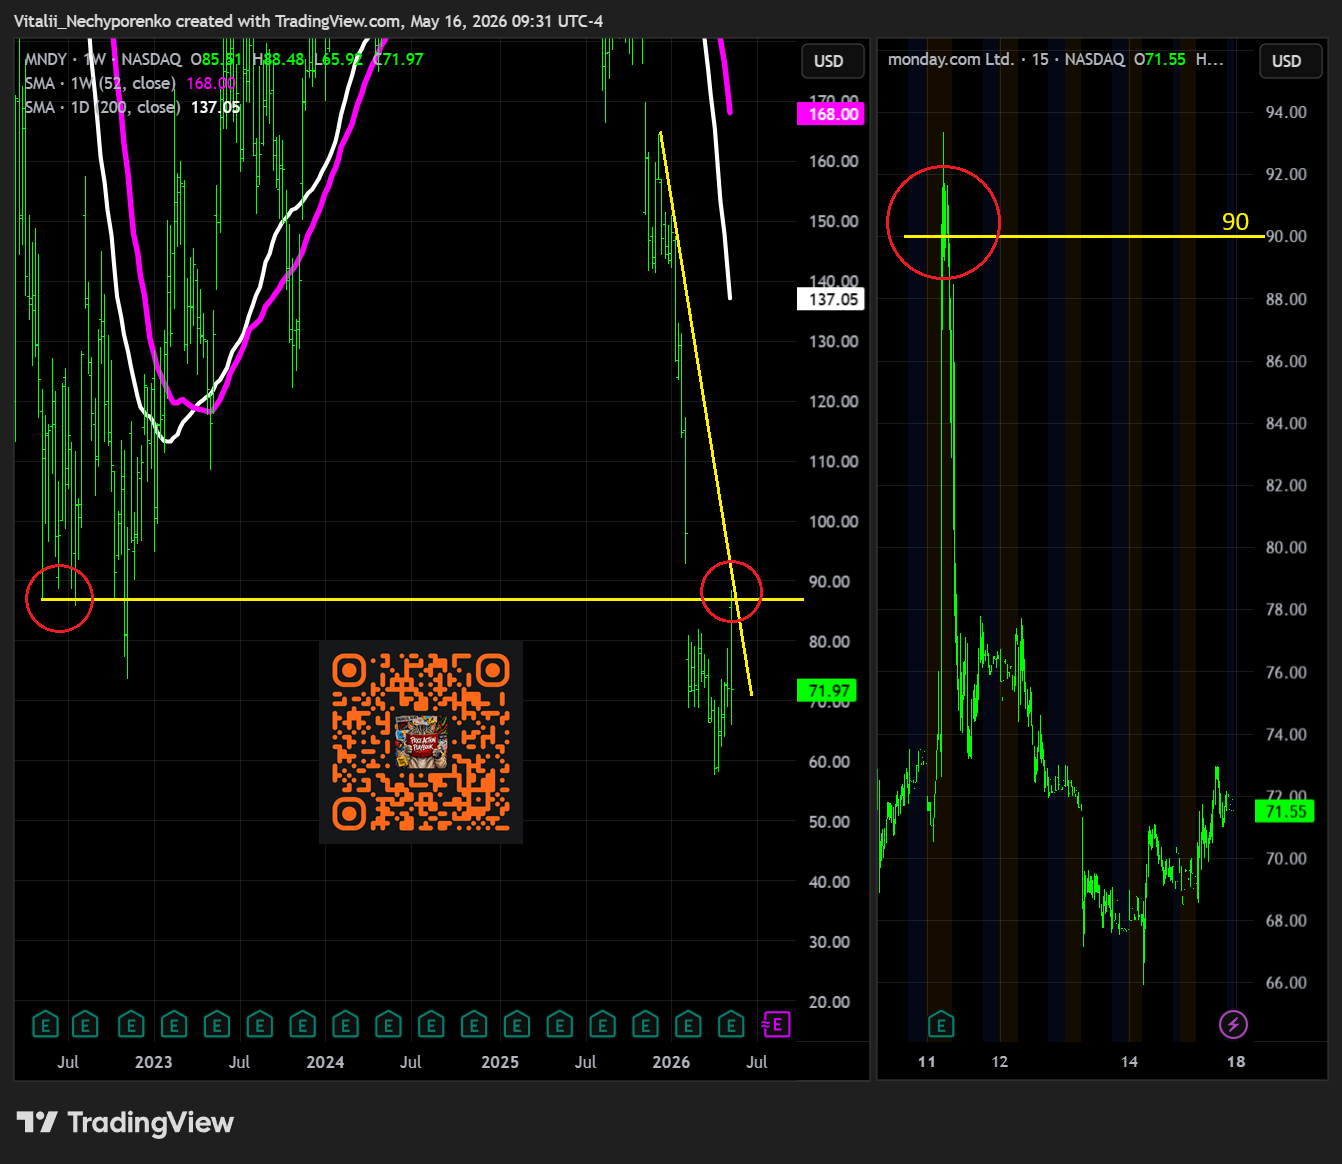
MNDY 90
Monday.com delivered a strong beat-and-raise quarter, with revenue growing 24.4% YoY to $351.3 mln while large customer expansion remained a key highlight across the platform. Customers generating more than $100,000 in ARR increased 39% YoY, while the number of customers above $500,000 in ARR surged 74%, highlighting stronger enterprise adoption and deeper penetration within larger organizations. Current remaining performance obligations also accelerated 26% YoY to $716 mln, supporting healthy forward visibility despite ongoing FX headwinds. Management guided Q2 revenue roughly in line with expectations but raised full-year guidance above consensus, reflecting confidence in demand durability, expanding multi-product adoption, and ongoing demand across its enterprise workflow ecosystem.
90 is the area where a recent weekly DTL coincides with a prior weekly pivot low. Once the stock was rejected there, selling quickly intensified, leading to an FGF and beyond. Maybe that’s why people prefer Friday to Monday.