


Key Takeaways This Week
Quadruple Witching lands into rising volatility, making the positioning reset potentially more important than the expiration itself.
The VIX signal appeared, but macro forces may matter more than mechanical setups right now.
Bulls still have a chance, but the fight increasingly looks like a judges’ decision rather than a knockout.
Last week’s movers: HIMS, AVAV, ORCL, ADBE and ULTA
Earnings to watch this week: DLTR, LULU, OKLO, MU, ACN, BABA and FDX
Table of Contents
Market Overview
Key Index Charts
Earnings & Interesting Movers Recap
Earnings to Watch This Week
1. Market Overview
Quick housekeeping note before we dive in:
Lucky Quarter Options Overview will be posted around Quadruple Witching as planned.
I will be in travel mode afterwards through the end of March, so there will be no Research updates during this period. Weekly Playbooks will either be lighter than usual or skipped as well.
We will return to the regular schedule at the beginning of April to be properly prepared for the upcoming earnings season.
Volatility moved back to the center of the tape this week as the strikes on Iran pushed oil toward the $100 area and forced markets to price a geopolitical risk premium that had been largely absent earlier in the year. Equities did not collapse on the headlines, but the reaction function shifted quickly. The S&P 500 finished the week lower by about 1.6% while the Nasdaq declined roughly 1.3%. Intraday ranges widened, hedging activity increased, and macro inputs began to dominate price discovery.
The Strait of Hormuz remains the focal point. Roughly one fifth of global oil supply, about 20 mln barrels per day, normally moves through that corridor. Even partial disruption forces traders to price a geopolitical premium into crude. Insurance costs rise, shipping slows, and the market begins to model scenarios where supply cannot normalize quickly. Mine clearing operations historically take weeks or months rather than days, meaning even limited disruptions can stretch far longer than initial headlines suggest.
Energy shocks rarely remain confined to the commodity complex. Higher oil prices work their way through transportation costs, utilities and industrial inputs before eventually appearing in consumer prices. Crude has already climbed sharply since the conflict escalated, and prolonged disruption could push prices materially higher. Markets tend to react to the economic consequences of energy rather than the headlines that trigger them.
The market response so far has been volatile but not disorderly. Initial selling was followed by rebounds as traders attempted to price a shorter conflict, only for risk assets to weaken again as crude continued rising. Volatility increased with the VIX moving toward the upper 20s, still below levels typically associated with capitulation. Technology held up better than many cyclical areas, though the Nasdaq briefly traded below its 200-day moving average during the week, a level many systematic strategies still monitor closely.
Credit markets also began showing early signs of stress. A flagship private credit vehicle reportedly received redemption requests exceeding 7%, while several large banks started marking down loan portfolios tied to software companies. These developments remain contained for now, but they highlight how quickly liquidity assumptions can change when borrowing costs rise while economic momentum softens.
That backdrop places the semiconductor ecosystem in an unusual position. Demand for compute infrastructure remains extremely strong, yet the supply chain supporting it sits directly inside the geopolitical crosscurrents. East Asian chip manufacturing depends heavily on imported energy from the Gulf region, particularly LNG used for electricity generation. Semiconductor equities across Taiwan and South Korea have already reacted to that exposure, reflecting how quickly geopolitical risk can feed into technology supply chains.
Outside the technology complex the macro picture continues to soften gradually. Fourth quarter GDP growth has been revised down to about 0.7%, while the labor market is showing early signs of cooling. Consumers are gradually shifting spending toward essentials such as housing and healthcare while discretionary demand softens. Activity is not collapsing, but the trend is clearly slowing.
That leaves the Federal Reserve meeting on Wednesday in a constrained position. Markets assign roughly a 98% probability that rates remain unchanged within the current 3.5%-3.75% range. Higher oil prices tighten financial conditions while softer economic data pushes in the opposite direction. Treasury yields drifted higher during the week, with the 10-year moving back toward the 4.3% area as investors reassessed inflation risks tied to energy prices.
Expectations for policy have already shifted. Earlier in the year traders anticipated several rate cuts before year end. That outlook has narrowed considerably as energy prices rise and inflation risks remain elevated. Supply-driven inflation shocks sit largely outside the Fed’s control, yet they influence the policy tradeoff directly.
Positioning dynamics may matter just as much as policy language in the near term. Friday brings the large quarterly options expiration known as Quadruple Witching. These events periodically reset the market’s mechanical positioning structure. Large options exposures can anchor price action temporarily as dealers hedge positions, only to release that pressure once contracts roll off.
This expiration arrives at a moment when volatility is already rising. If options positioning has been providing structural support during recent weeks, the removal of those positions could allow price discovery to accelerate once the reset occurs. Traders often focus on the expiration itself, but the sessions immediately afterward frequently reveal how much of the prior stability was mechanical rather than fundamental.
A couple of thoughts on the VIX signal:
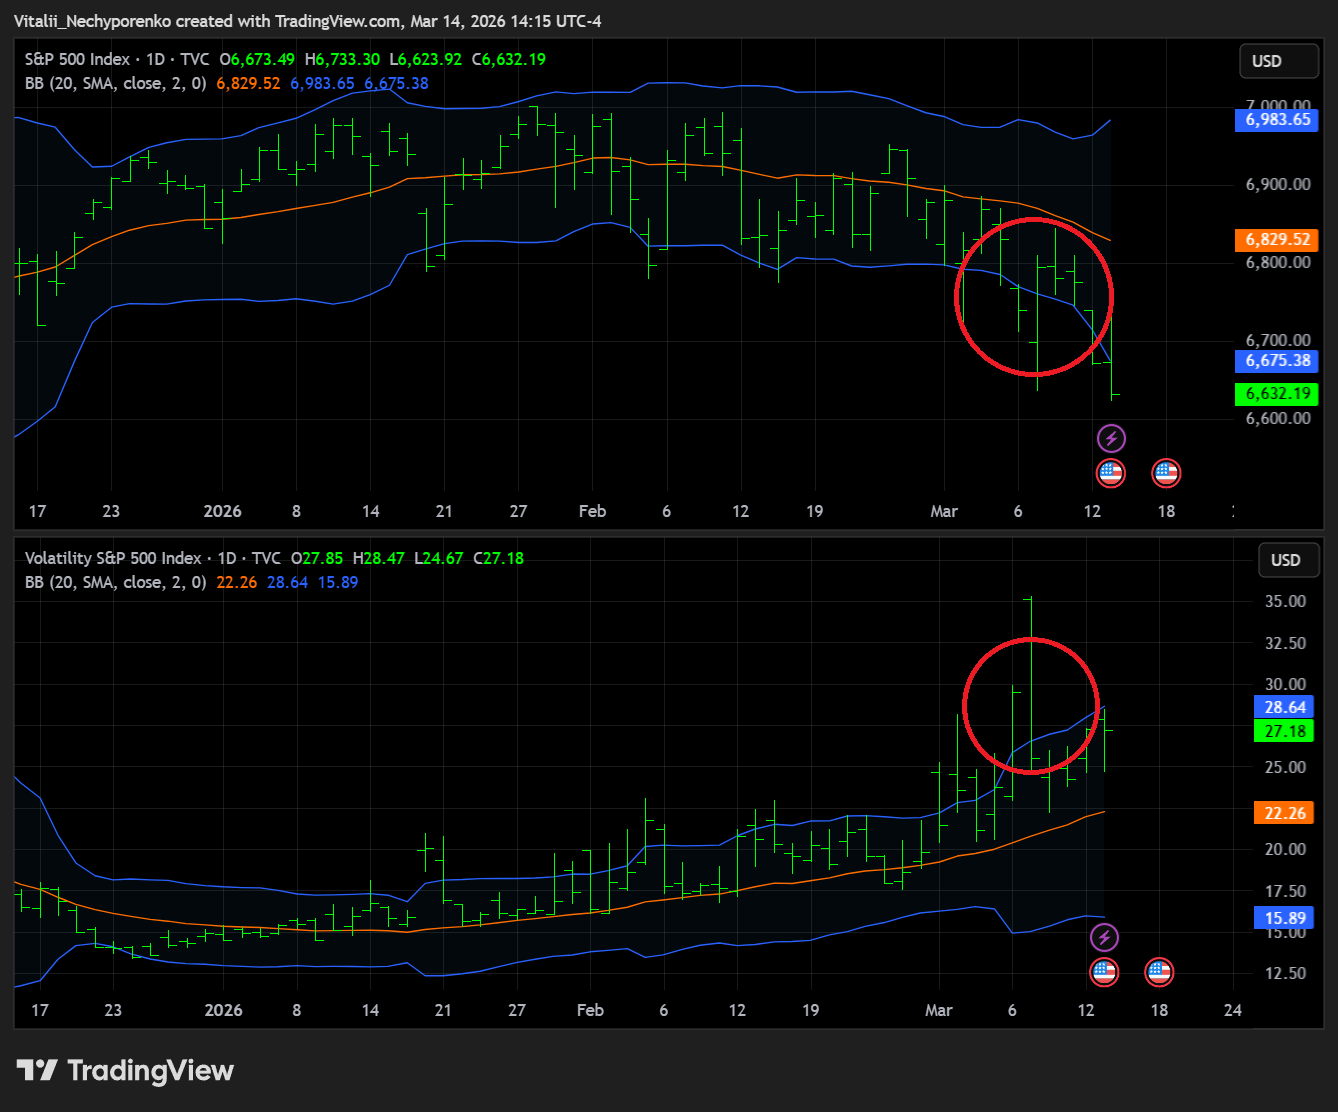
As I emphasized multiple times, every setup in the market is probability based. Even large opening imbalances can be offset within minutes, and there is no guarantee that a stock will open at the indicated clearing price. The same applies here. While the odds favor a bounce, there are times when larger forces are in play beyond pure market mechanics, and risk should be managed accordingly.
Meanwhile, nothing is broken yet. Bulls could still win here, but it is becoming clear that instead of a spectacular KO we might be waiting for the judges’ scorecards and some kind of split decision. On the other hand, it is the bears’ submission attempts or punching power that I would be more concerned about.
2. Key Index Charts
In this section I highlight only the most important zones with brief comments. I use fully layered charts to identify them, but keep the charts here clean for clarity.
On Sunday we actually got very close to the mentioned key support areas when futures opened, but when ECN opened we were already back to the reference points. The bounce on Monday was kind of textbook, though it seems like other pages went missing. The VIX signal is still in play, let’s see what next week brings, despite a bunch witches flying around and pouring liquidity on our heads😁 Let’s go to the charts:
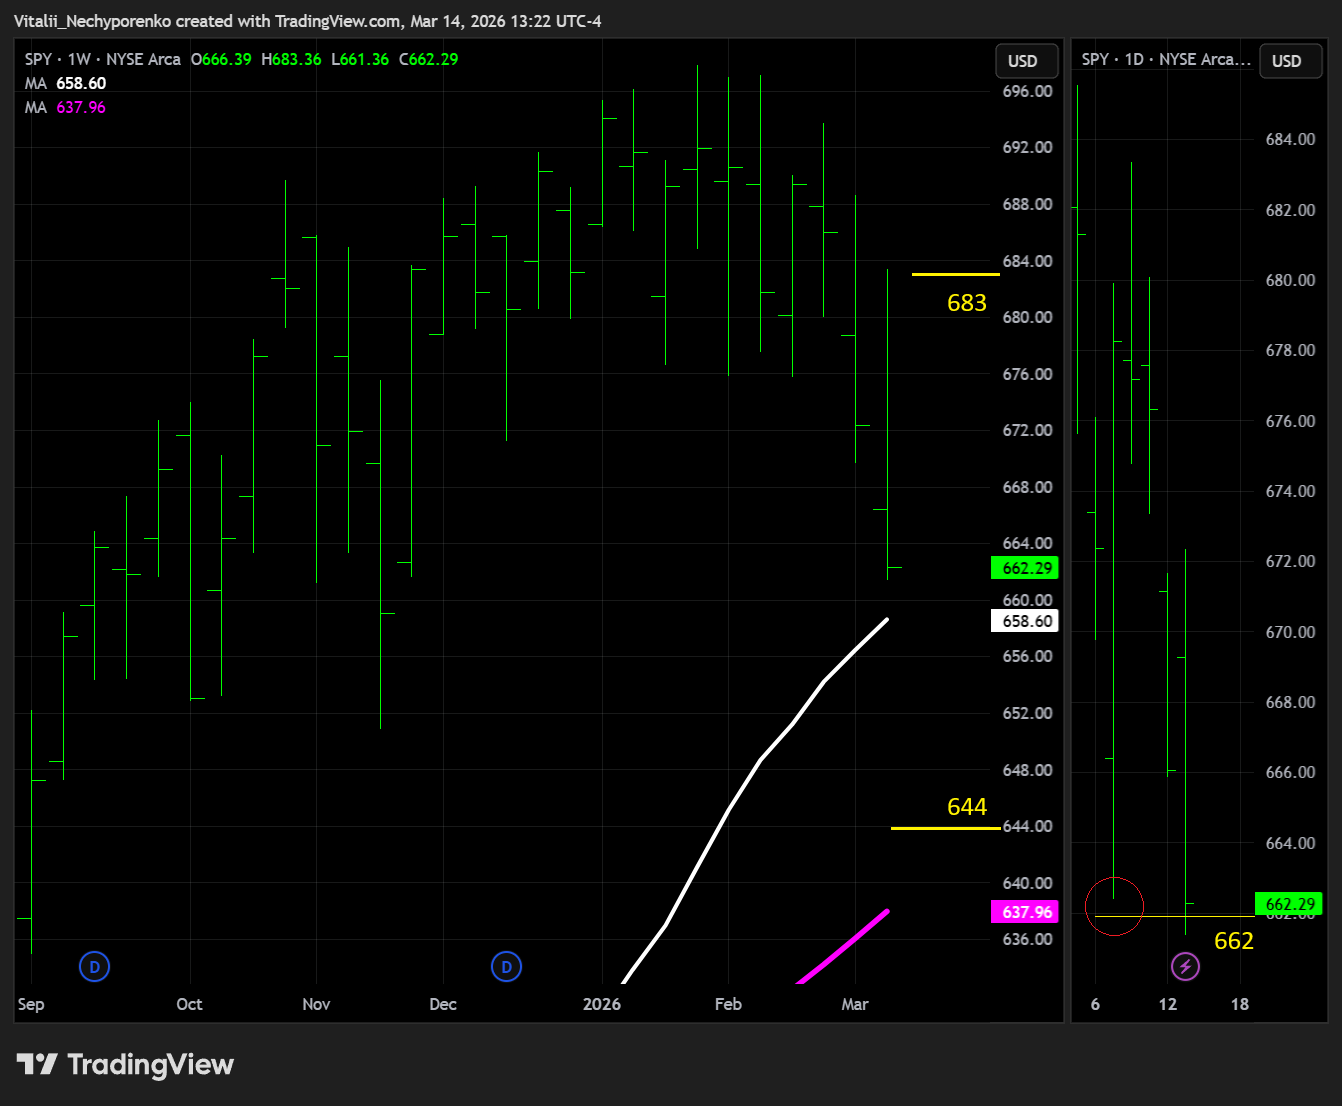
SPY
The S&P 500 ETF bounced off the 662 reference on Monday, only to close there on Friday. It has been a trader’s market for a while and chances are it will continue to be so. With the 200d in plain sight, further weakness might be on the table. Key support remains at 644 and needs to hold, while key resistance shifts to 683.
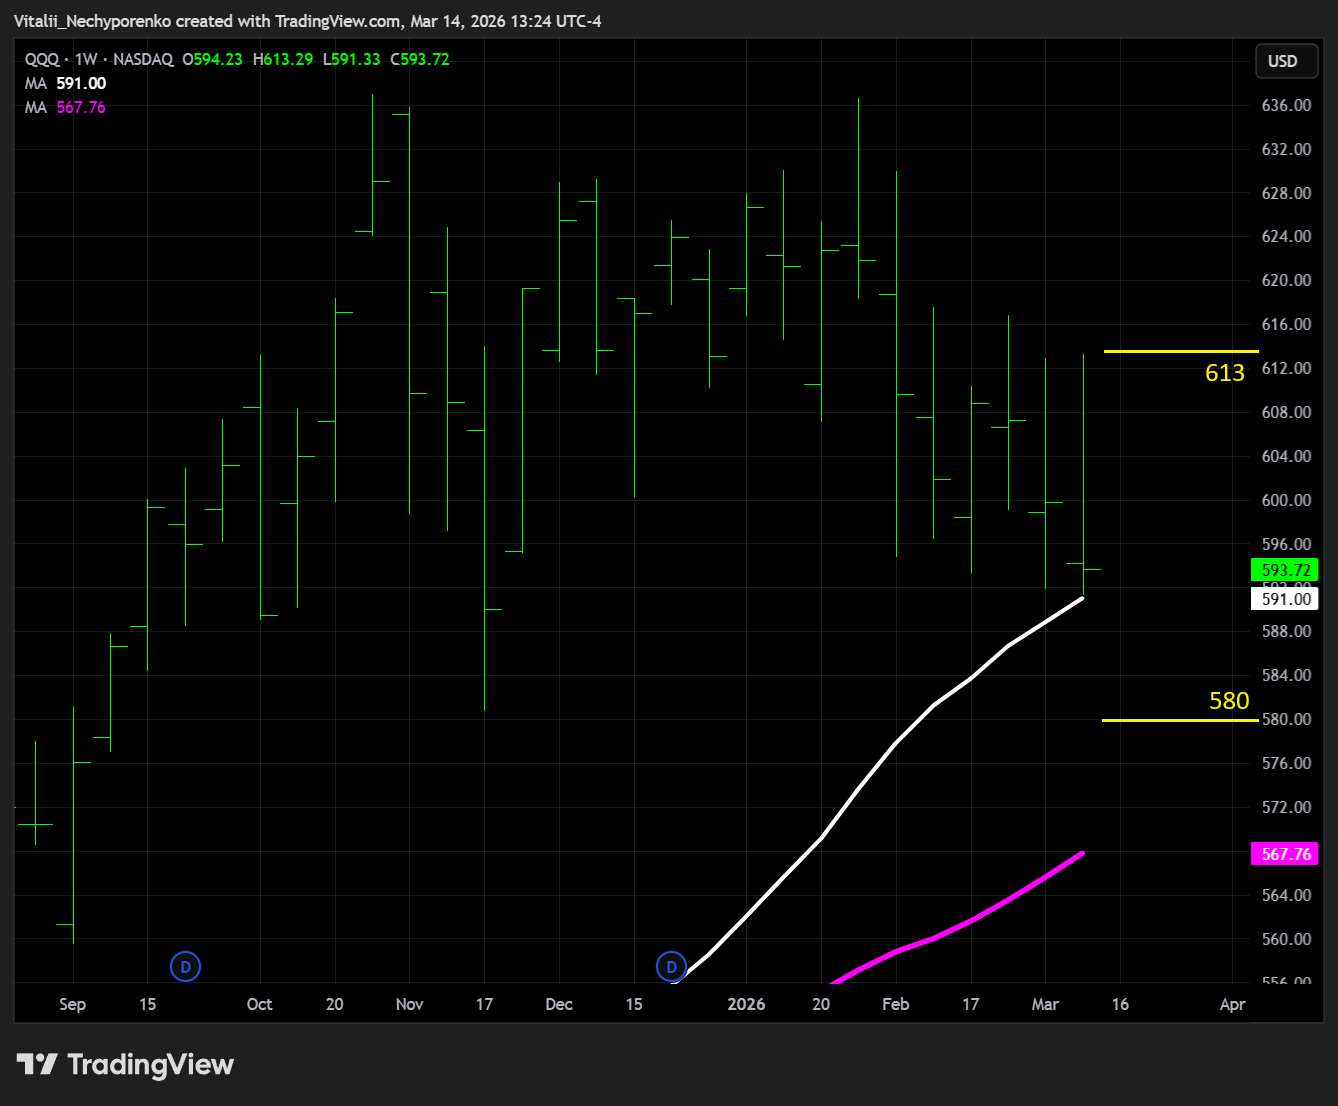
QQQ
The Nasdaq 100 ETF looks slightly weaker and the 200d has already been tested here. If flipped, key support at 580 might come into play quickly, while key resistance shifts to 613.
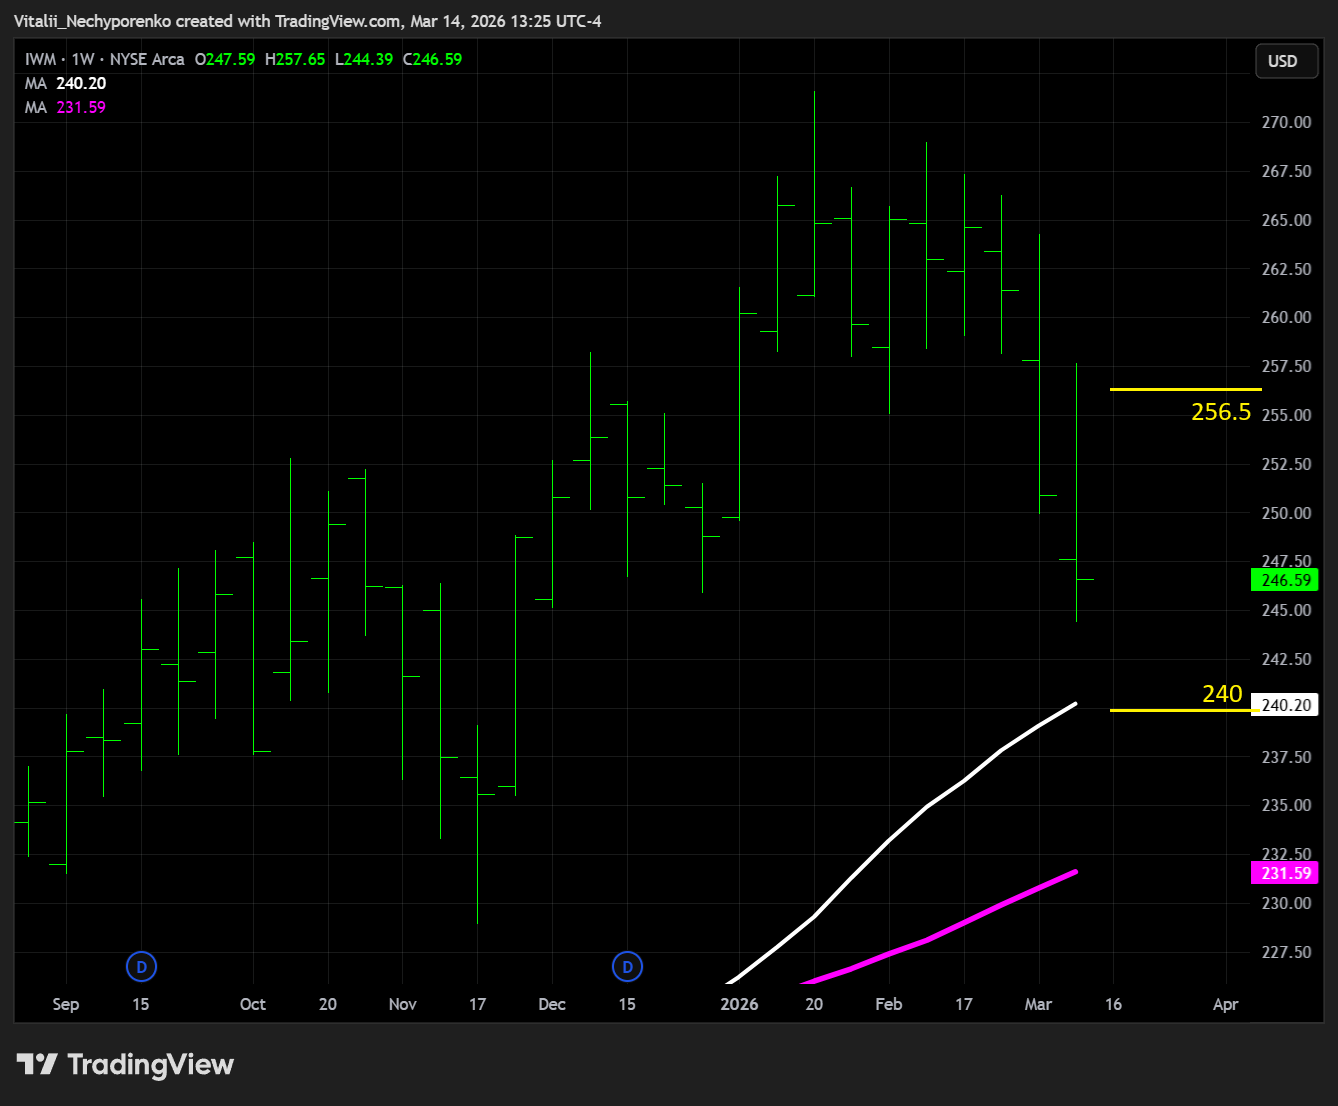
IWM
The Russell 2000 ETF continues to underperform, with key support at 240 in plain sight as well. Key resistance shifts to 256.5, slightly above the notorious 255 and aligning with the weekly trendlines.
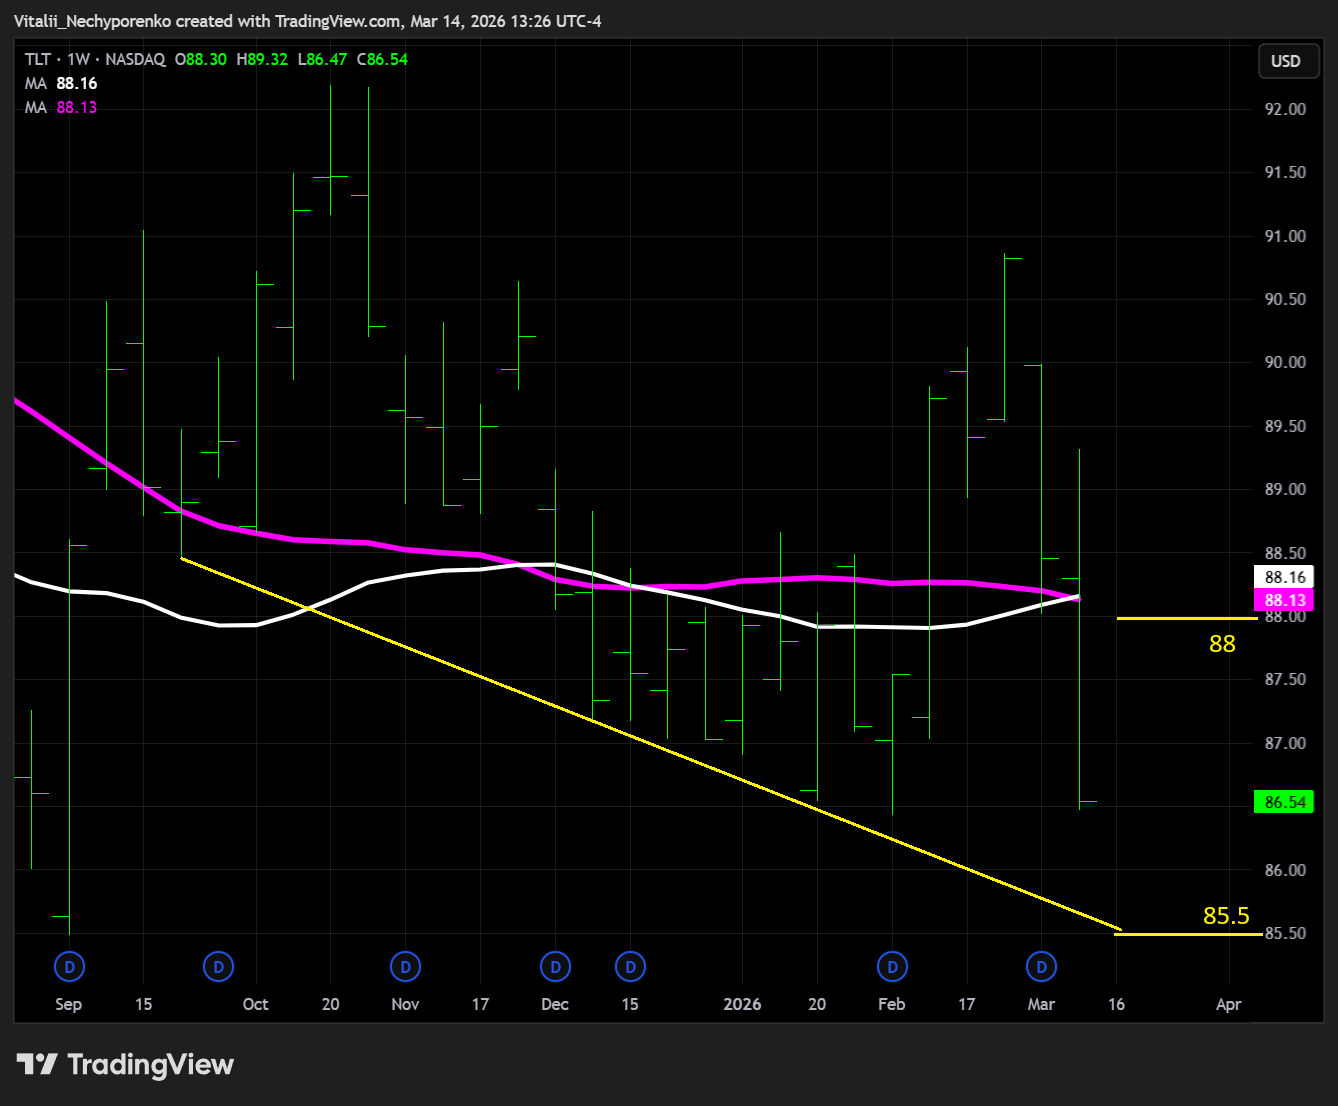
TLT
The 20+ Year Treasury Bond ETF didn’t hold 88, trapping those who got in above the 200d. Key resistance now stays here, while key support shifts lower to 85.5, where the recent BSL aligns with the pivot low.
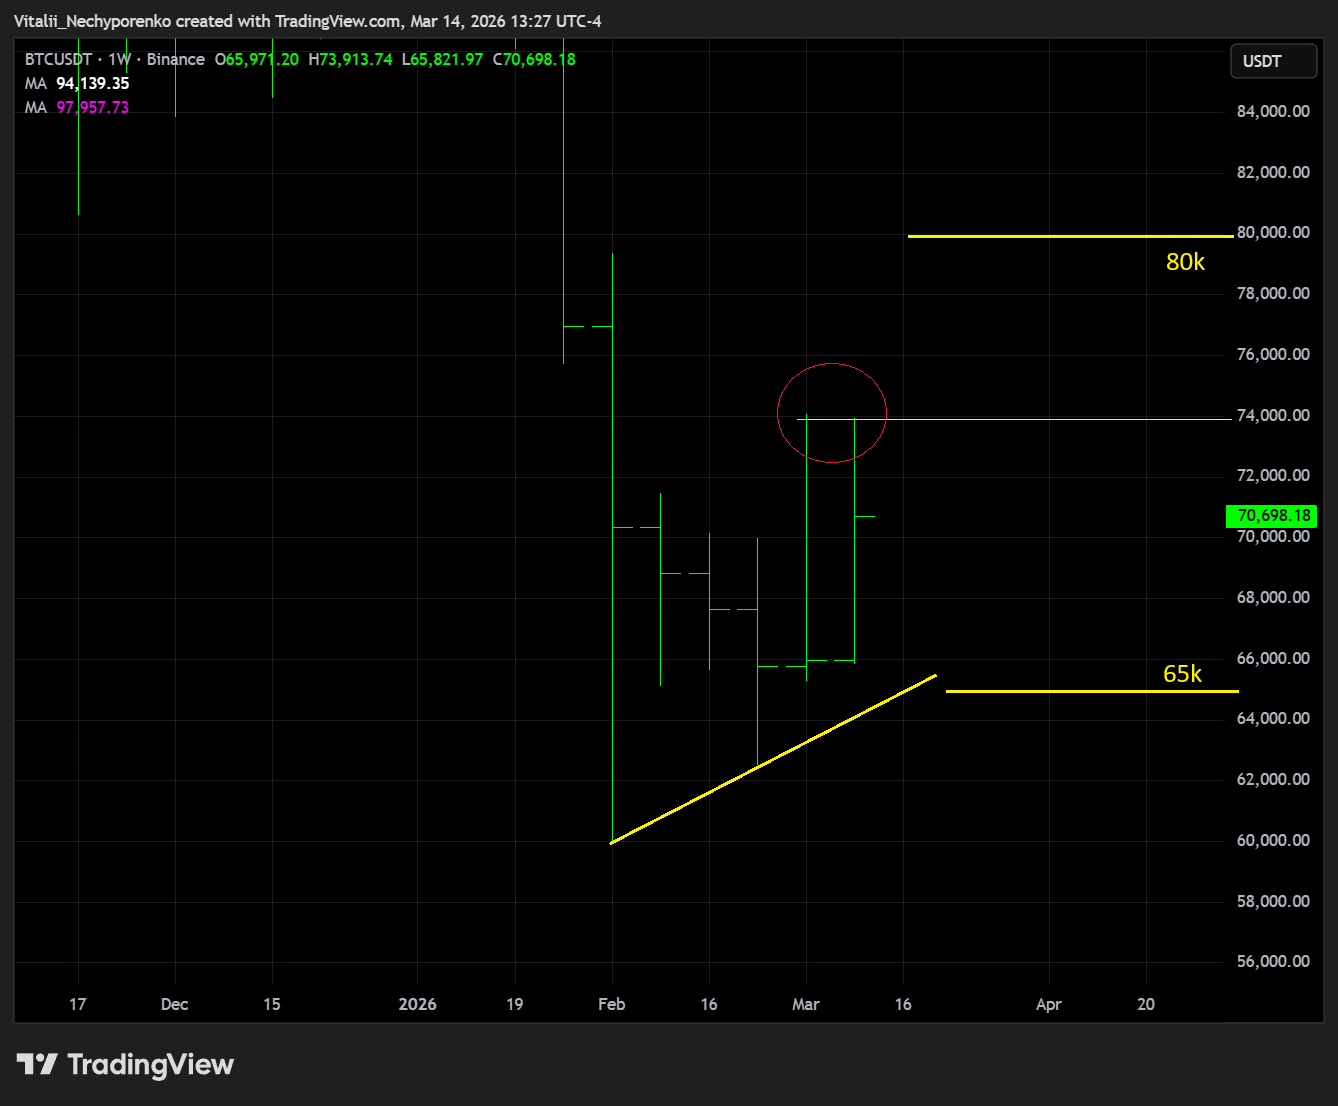
BTC
Bitcoin tried the previously highlighted 74k once again and didn’t like it. If it finally flips, 80k is on watch. However, there has been a lot of sentiment shift from bearish to bullish lately, and keep in mind that neither the tape nor the technical pattern backs that. If a lot of bullish bets get concentrated here, we all know what might happen. Key support shifts higher to 65k and it better hold.
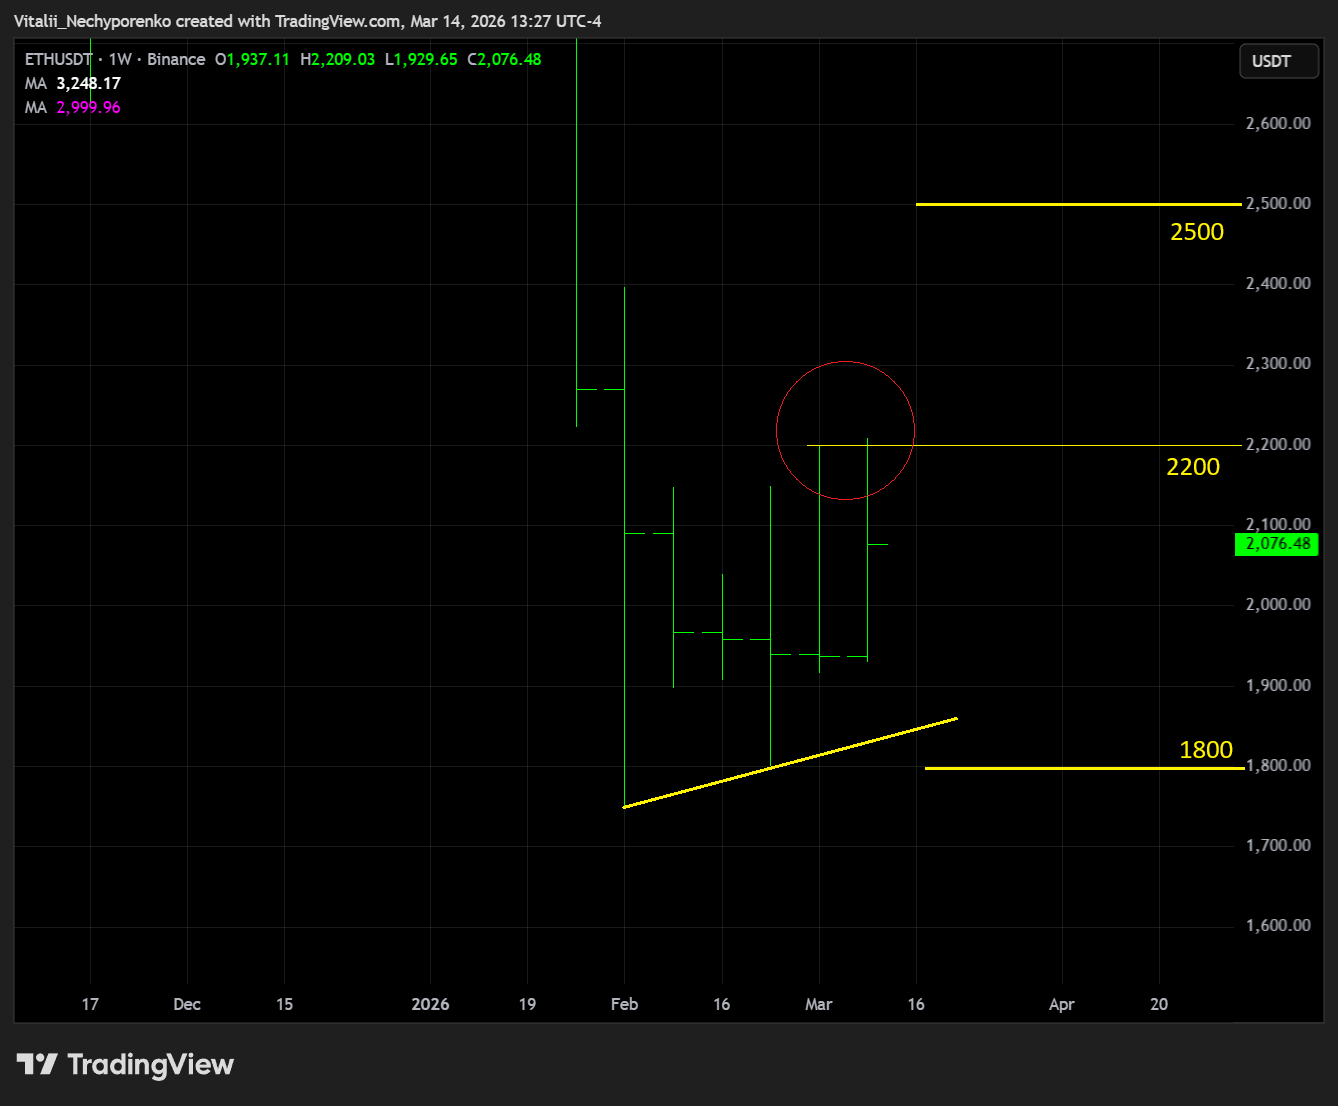
ETH
Ethereum also got another rejection around the 2200 area. Similarly to Bitcoin, if flipped, 2500 might be next. Though key support shifts to 1800 and needs to hold. Usually one man’s higher low is another man’s bear flag. We will find out who is right sooner or later.
3. Earnings & Interesting Movers Recap
HIMS
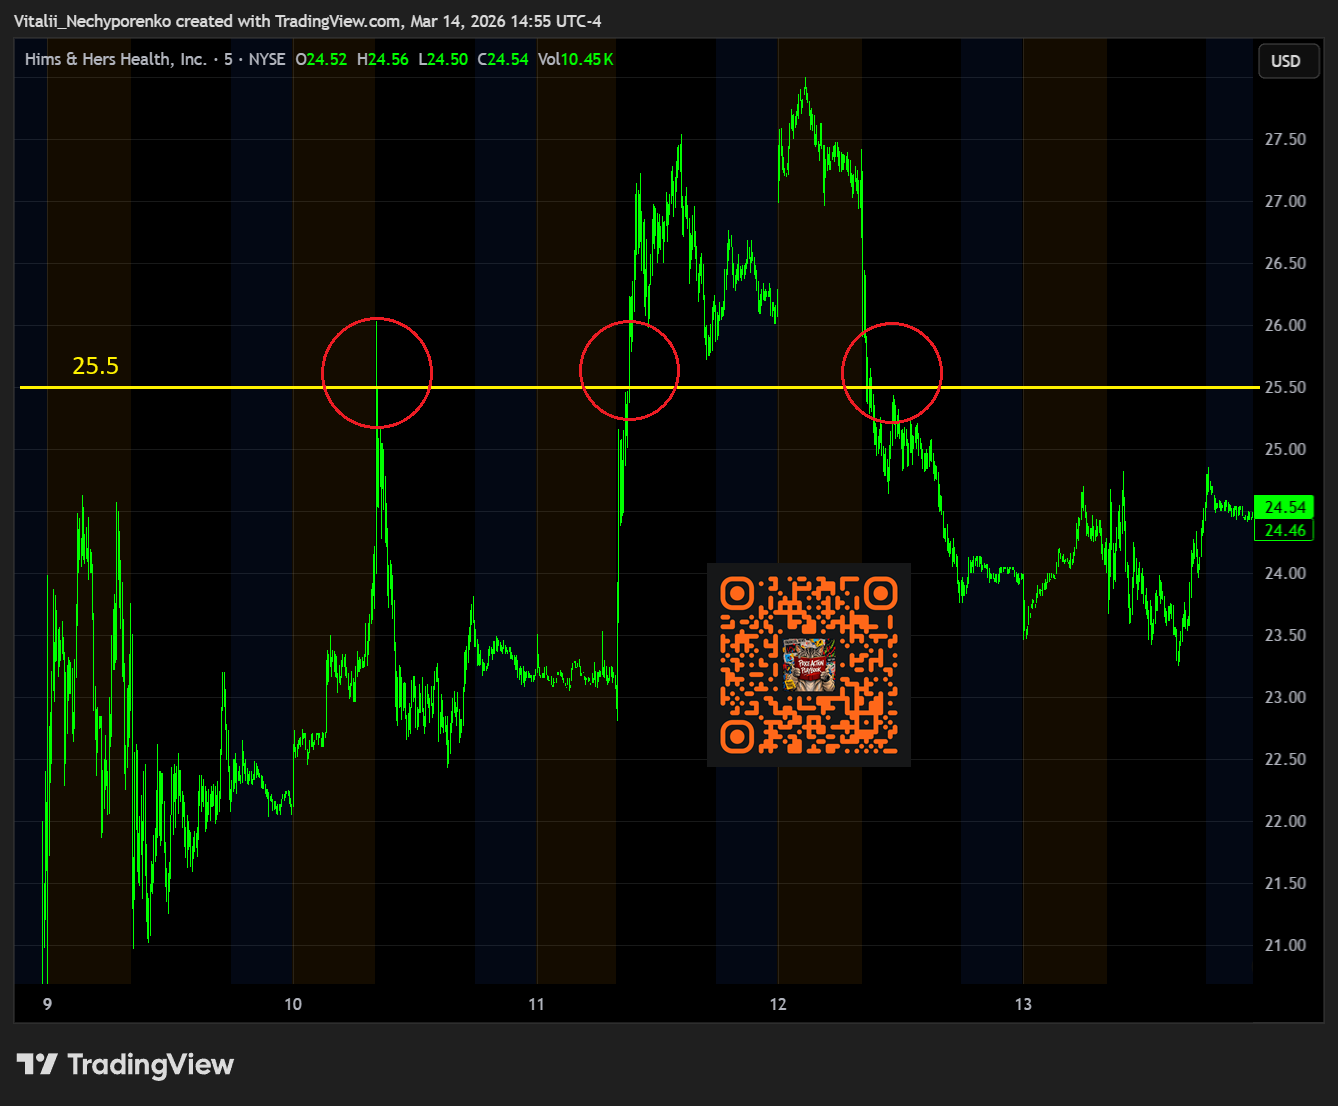
Hims & Hers confirmed a strategic shift in its U.S. weight loss business by partnering with Novo Nordisk to offer FDA-approved GLP-1 medications including Wegovy and Ozempic through its telehealth platform, moving away from broadly marketed compounded semaglutide products. The change aligns the company’s domestic strategy with its global model while resolving a legal dispute with Novo Nordisk and restoring a high visibility revenue stream that had faced regulatory scrutiny. Under the agreement, patients will gain access to multiple semaglutide dosage formats at competitive self pay prices, while existing compounded GLP-1 users may transition to FDA-approved alternatives when clinically appropriate. Strategically the collaboration strengthens Hims’ position within the rapidly expanding weight loss treatment market by aligning it with a dominant pharmaceutical partner and expanding its role as a telehealth distribution channel for branded therapies. However investors are also weighing margin and dependency risks since selling branded medicines typically offers lower profitability than compounded formulations while tying growth more closely to Novo Nordisk’s supply, pricing and partnership dynamics.
In the Price Action Playbook: Research that day I highlighted 25.5 as the key area to watch. Here is the big picture chart that explains the logic behind it:
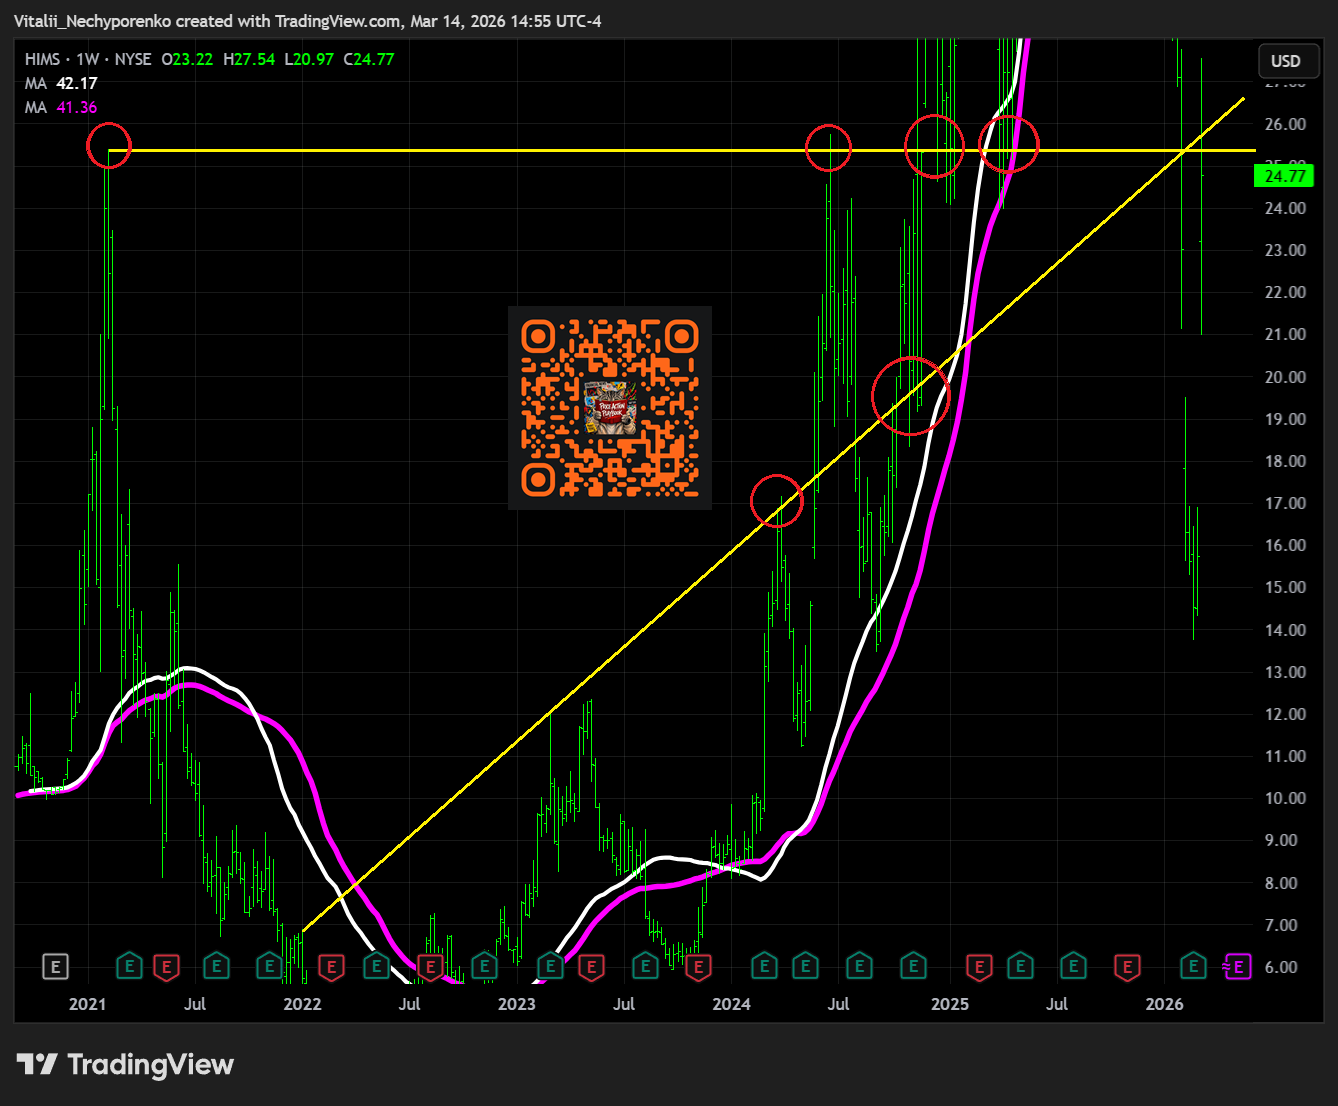
The prior weekly pivot high and the old weekly TRL already make the area fairly solid, with the 2.5 IPOx (or SPACx if you will) adding further significance. If the area is flipped we might see 30+, though a clear rejection could bleed it back toward 16.25.
AVAV
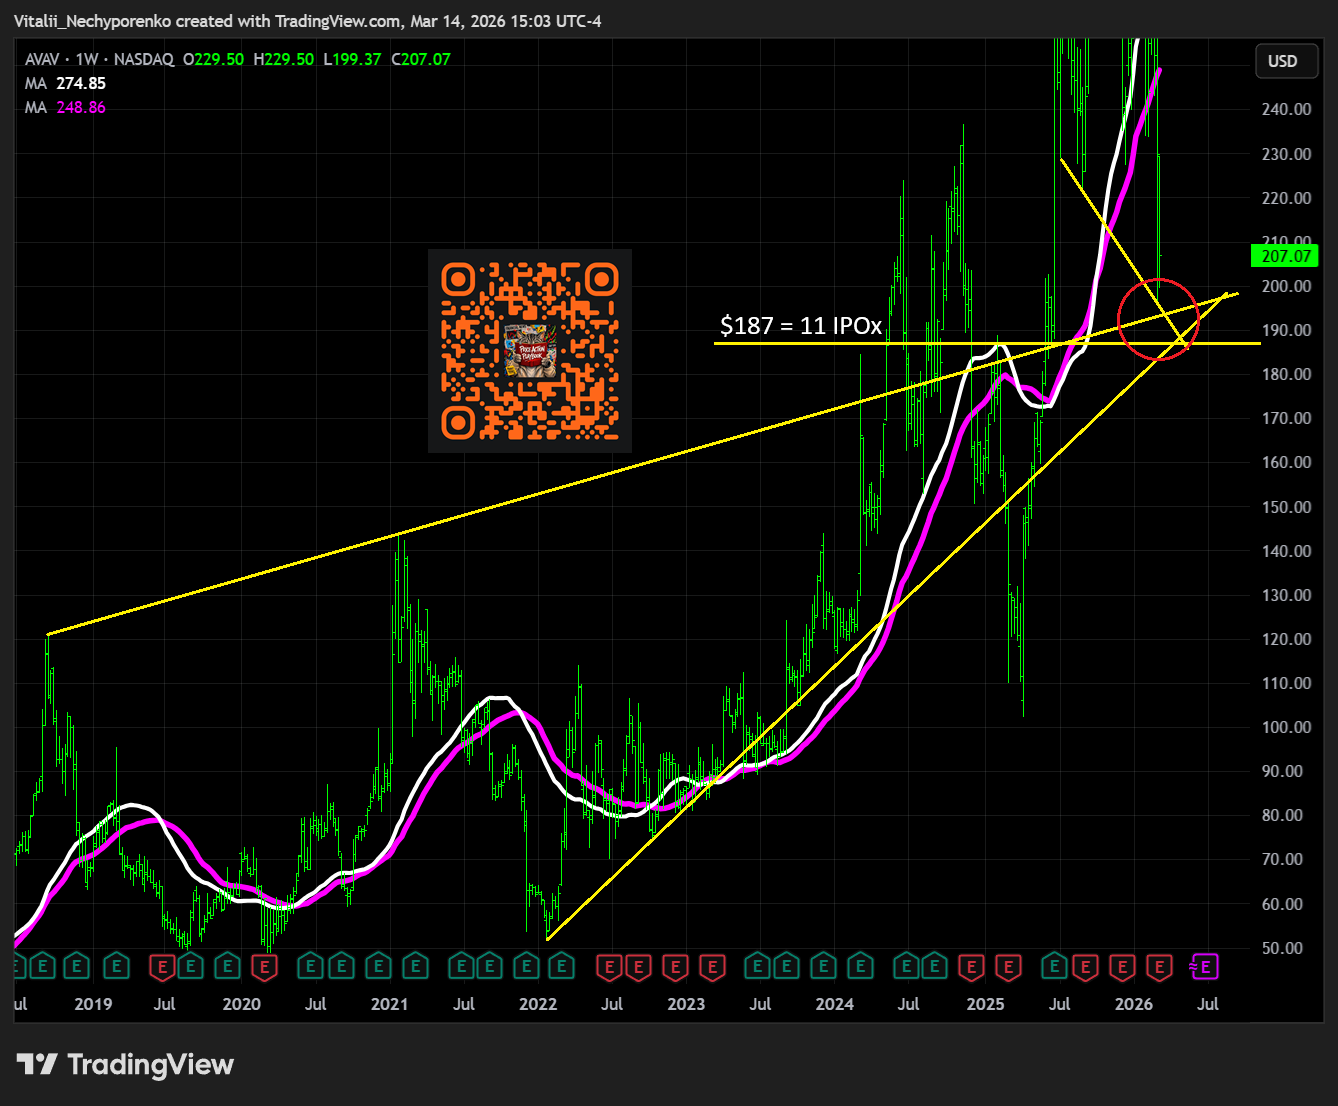
AeroVironment reported disappointing Q3 results and lowered its FY26 outlook as disruptions tied to the SCAR satellite communications program and timing shifts related to the U.S. government shutdown weighed on results despite strong underlying demand. Revenue surged 143% YoY driven largely by the integration of BlueHalo and continued strength in unmanned systems, though the top line still missed expectations due to order delays and adjustments within the Space business. EPS also fell short as profitability was pressured by a $151.3 mln impairment charge and margin headwinds tied to program mix and delayed higher margin contracts. The Autonomous Systems segment generated roughly 68% of revenue supported by continued demand for platforms such as Switchblade loitering munitions, Puma and P550 UAS systems, and counter UAS solutions, while results in the Space, Cyber and Directed Energy segment were impacted by a stop work order tied to the SCAR program, which was ultimately terminated as the U.S. Space Force revises requirements. Bookings remained strong with year to date awards totaling about $4.6 bln and funded backlog reaching roughly $1.1 bln, while management now guides FY26 EPS to $2.75-$3.10, revenue to $1.85-$1.95 bln, and adjusted EBITDA to $265-$285 mln as the company expects delayed government orders to shift into later periods despite continued robust demand across its defense and autonomous systems portfolio.
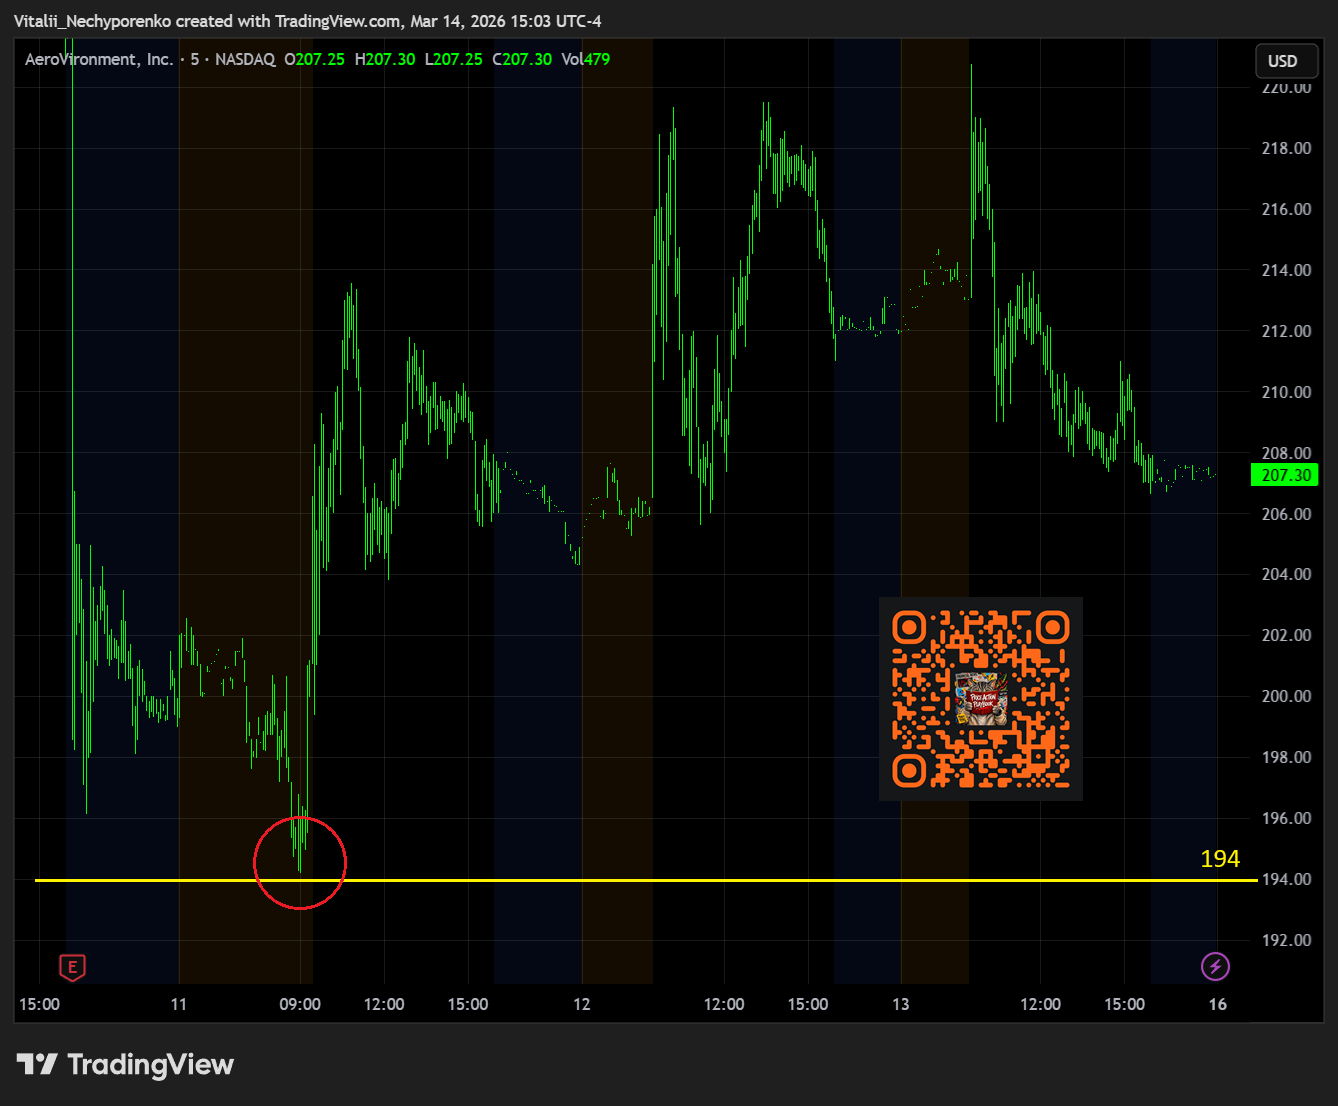
In the latest Weekly Playbook I highlighted 186.5-194.5 as key support areas, though I later shifted that slightly to 194 for better precision. These levels are essentially the upper and lower bounds of the same zone, formed by a fresh weekly BSL and two older but still fairly reactive weekly trendlines. Add the 11 IPOx at 187 to the mix as well. Here is the big picture chart:
As you can see, as soon as price reached the area buyers stepped in with some vicious bids. However the gap wasn’t filled, and another attempt to flip that area might be on deck.
ORCL
Oracle reported strong Q3 results with both EPS and revenue exceeding expectations while highlighting accelerating demand tied to AI infrastructure and cloud services. The quarter marked the first time in more than 15 years that both organic total revenue and organic non GAAP EPS grew at 20% or more, supported by rapid expansion across multiple AI related segments. Multicloud Database revenue surged 531% YoY as enterprise demand for Oracle databases across cloud platforms continued to accelerate, while AI Infrastructure revenue jumped 243% YoY with management noting that demand for both GPU and CPU capacity remains above available supply. Remaining Performance Obligations reached $553 bln, rising 325% YoY and reflecting a large pipeline of contracted AI infrastructure projects that often include upfront customer prepayments to fund equipment buildouts. Oracle reaffirmed its FY26 CapEx guidance of $50 bln while pushing back on concerns that AI spending may not translate into revenue growth, and management issued a stronger than expected FY27 revenue outlook of roughly $90 bln, signaling confidence that AI driven demand will continue supporting expansion across its cloud and enterprise platform.
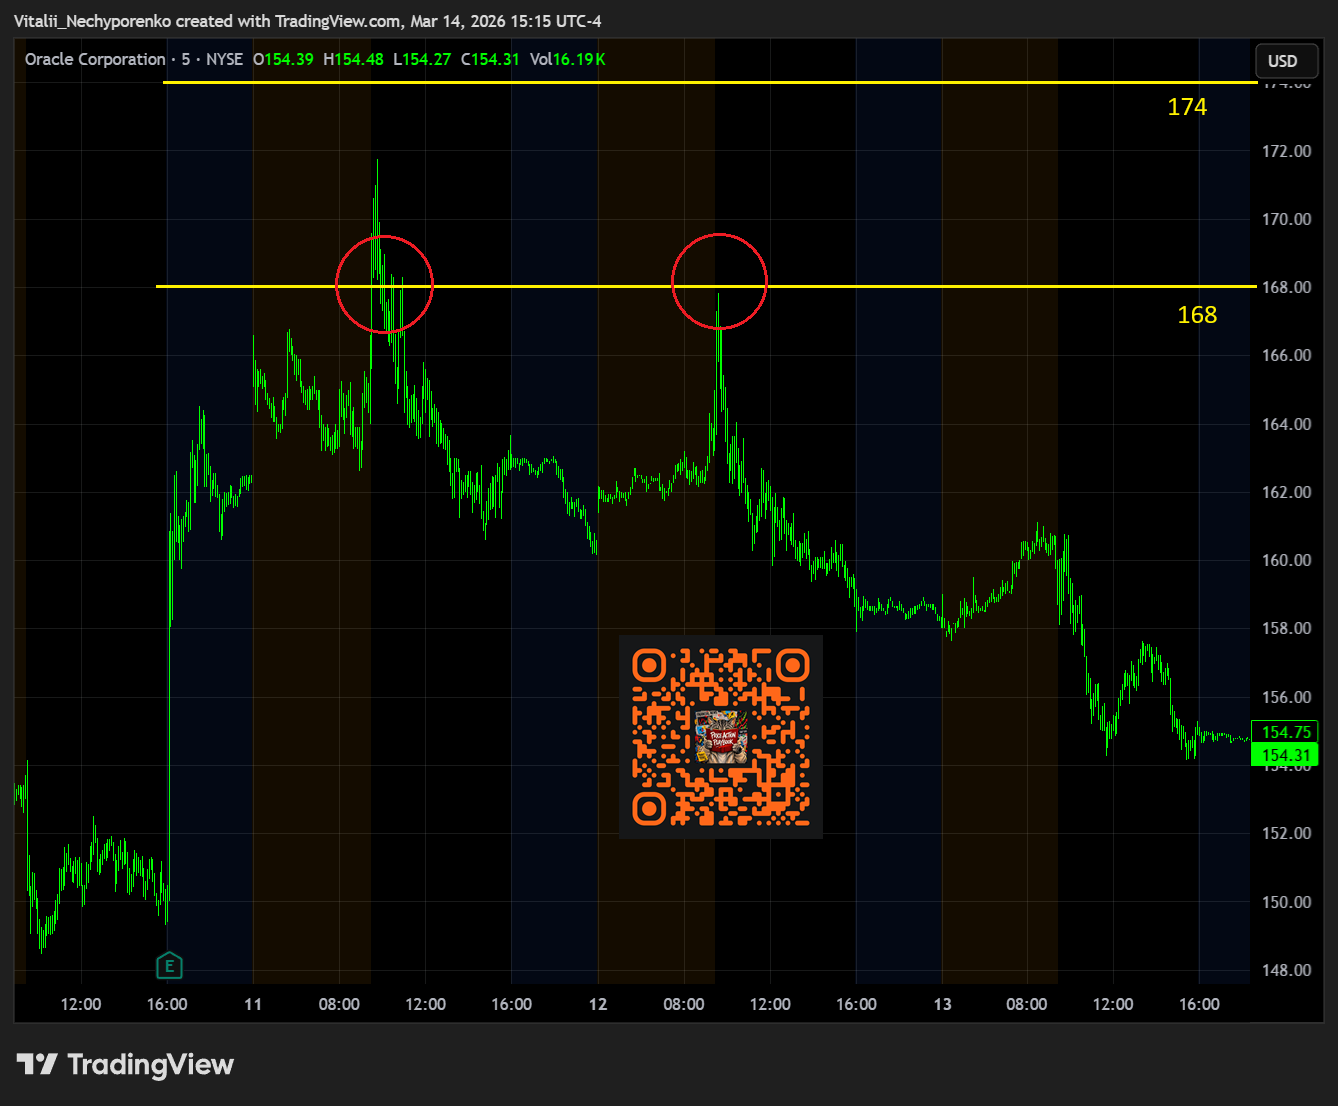
In the latest Weekly Playbook I highlighted 168-174 as key resistance areas to watch:
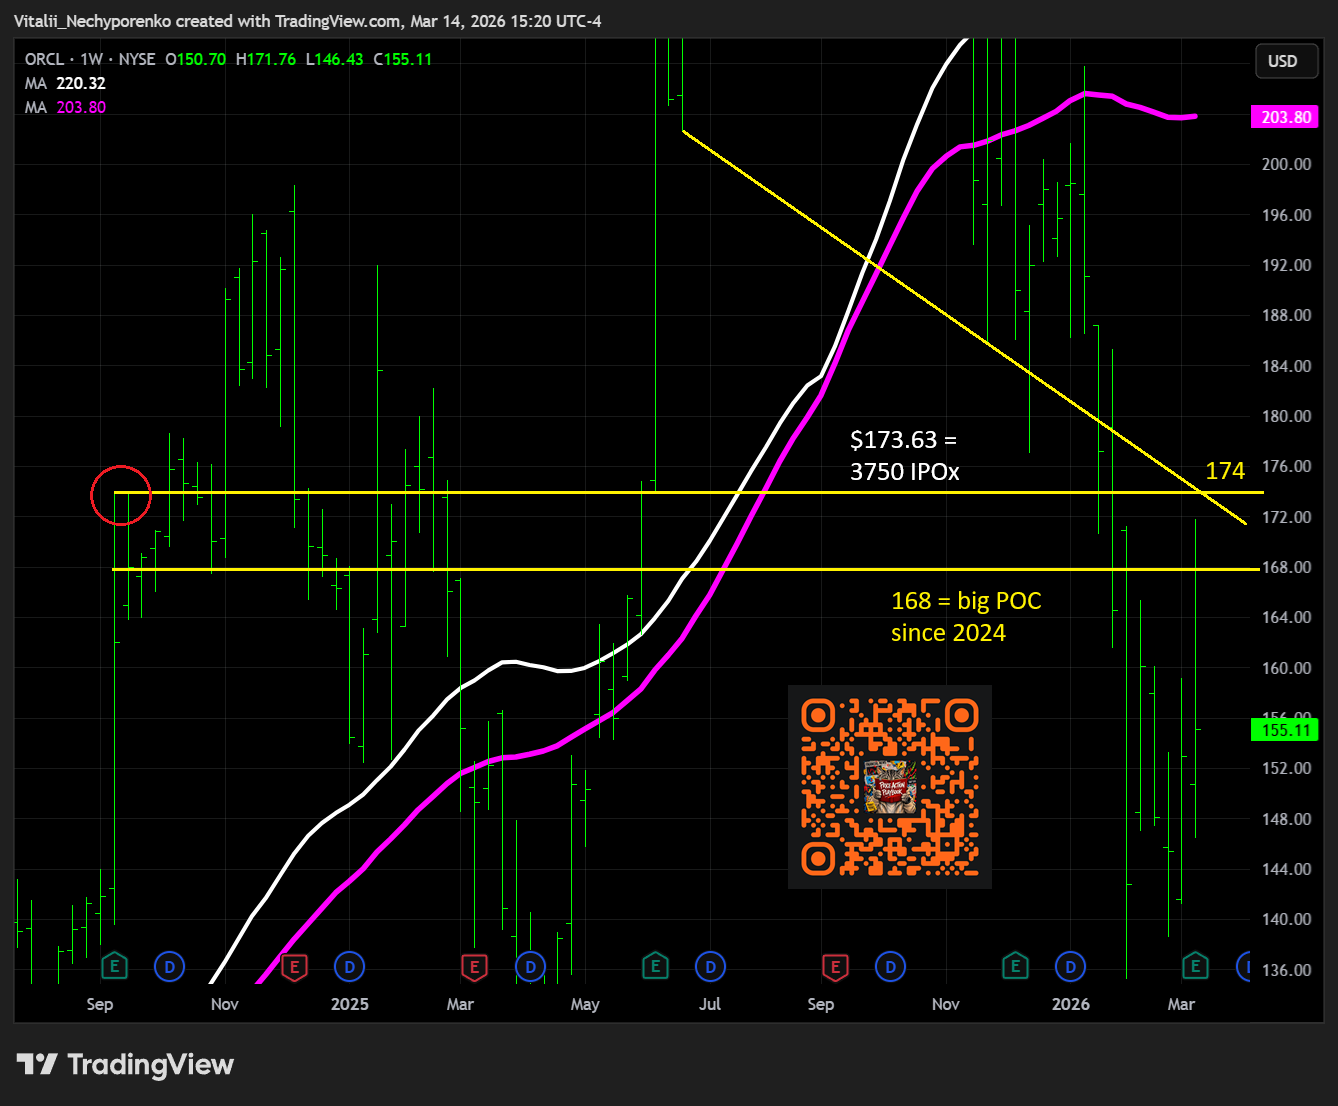
The 174 level is the old pivot high that also aligns with the 3750 IPOx at 173.63 and a fresh but reactive weekly BSL. The 168 level is the big POC since 2024, sitting on top of a couple of MM targets from the recent lows. Unless reclaimed, it could stay dead money for a while.
ADBE
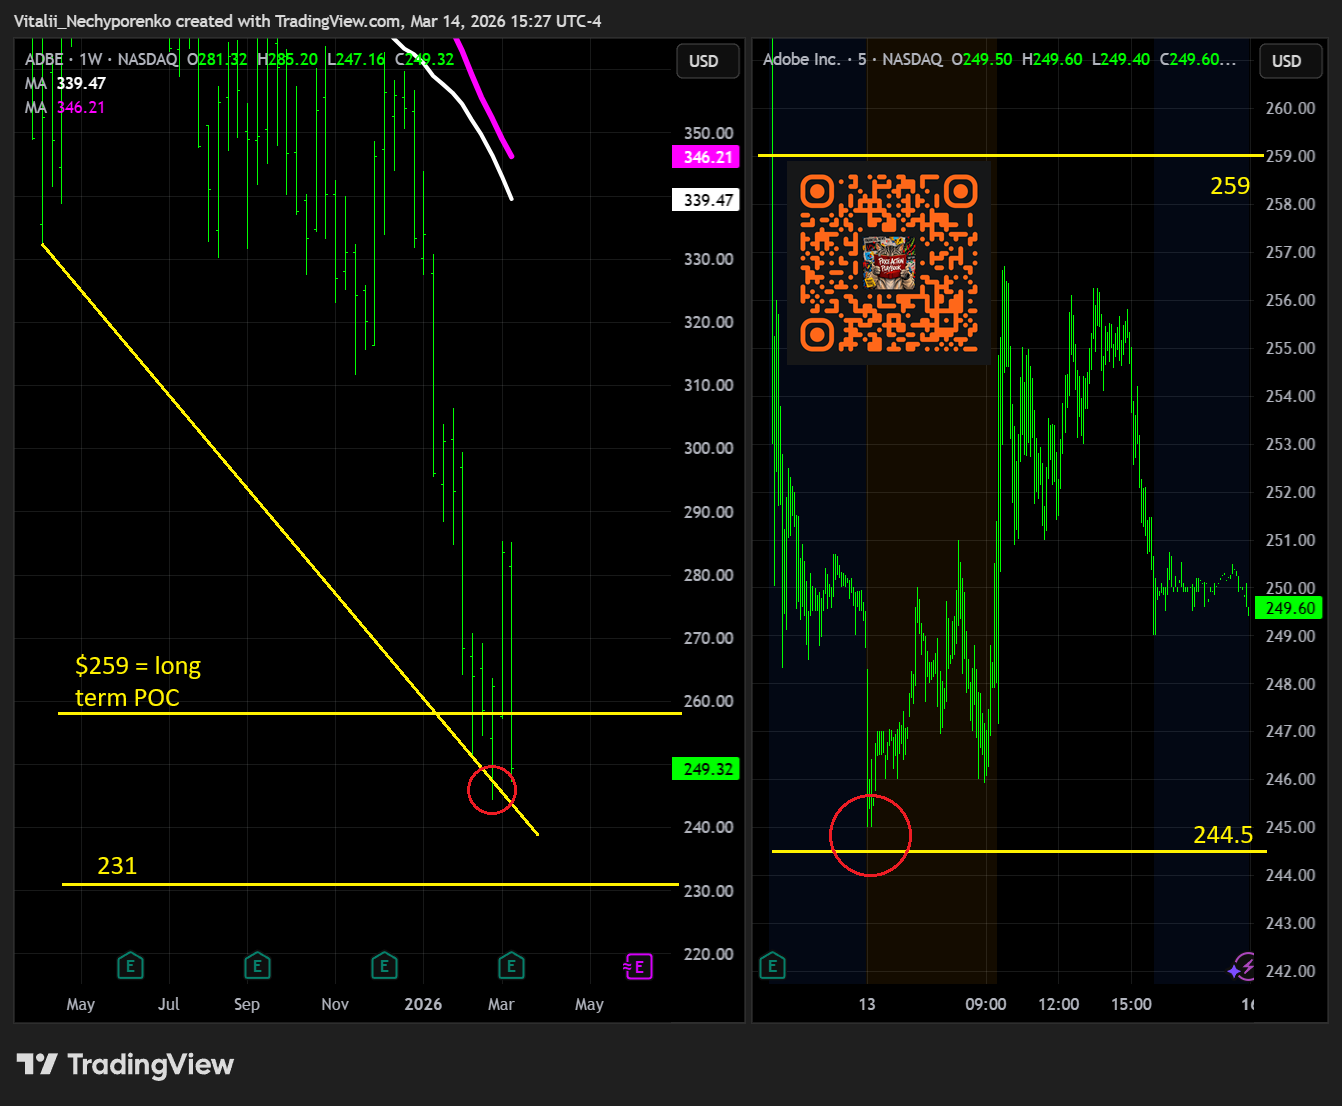
Adobe reported solid Q1 results with revenue rising 12% YoY to $6.40 bln and non GAAP EPS increasing 19% to $6.06, while total ARR reached $26.06 bln, up 10.9% YoY though slightly below expectations due to weakness in the traditional Adobe Stock business. Growth was supported by continued expansion across the company’s core platforms as Business Professionals and Consumers revenue rose 16% to $1.78 bln driven by strong Acrobat and Express adoption, while Creative and Marketing Professionals revenue increased 12% to $4.39 bln with GenStudio and AEP and Apps ARR each growing more than 30%. AI adoption accelerated sharply with AI first ARR more than tripling YoY and Firefly ARR surpassing $250 mln while generative credit consumption rose 45% sequentially, though rapid adoption of generative tools is also accelerating the decline of the roughly $450 mln Adobe Stock segment. Management guided Q2 revenue to $6.43-$6.48 bln with EPS of $5.80-$5.85 while reaffirming FY26 ARR growth of about 10.2%, though investor sentiment was pressured by modestly light ARR results, the faster than expected erosion of Stock revenue tied to generative AI adoption, and the announcement that CEO Shantanu Narayen will step down after a successor is named while remaining as chair.
In the latest Weekly Playbook I highlighted 244.5-259 as key support areas, though I later had to shift them lower to 231 and 244.5 pre-EPS to reflect the stock’s move into the numbers. The 259 level meanwhile is one of the most important long term POCs for this stock. The 244.5 level is where a fresh but reactive weekly BSL sits and where bulls stepped in, slightly frontrunning the area, while 231 is the old weekly pivot high and could still be revisited unless 259 is reclaimed in a decisive way.
ULTA
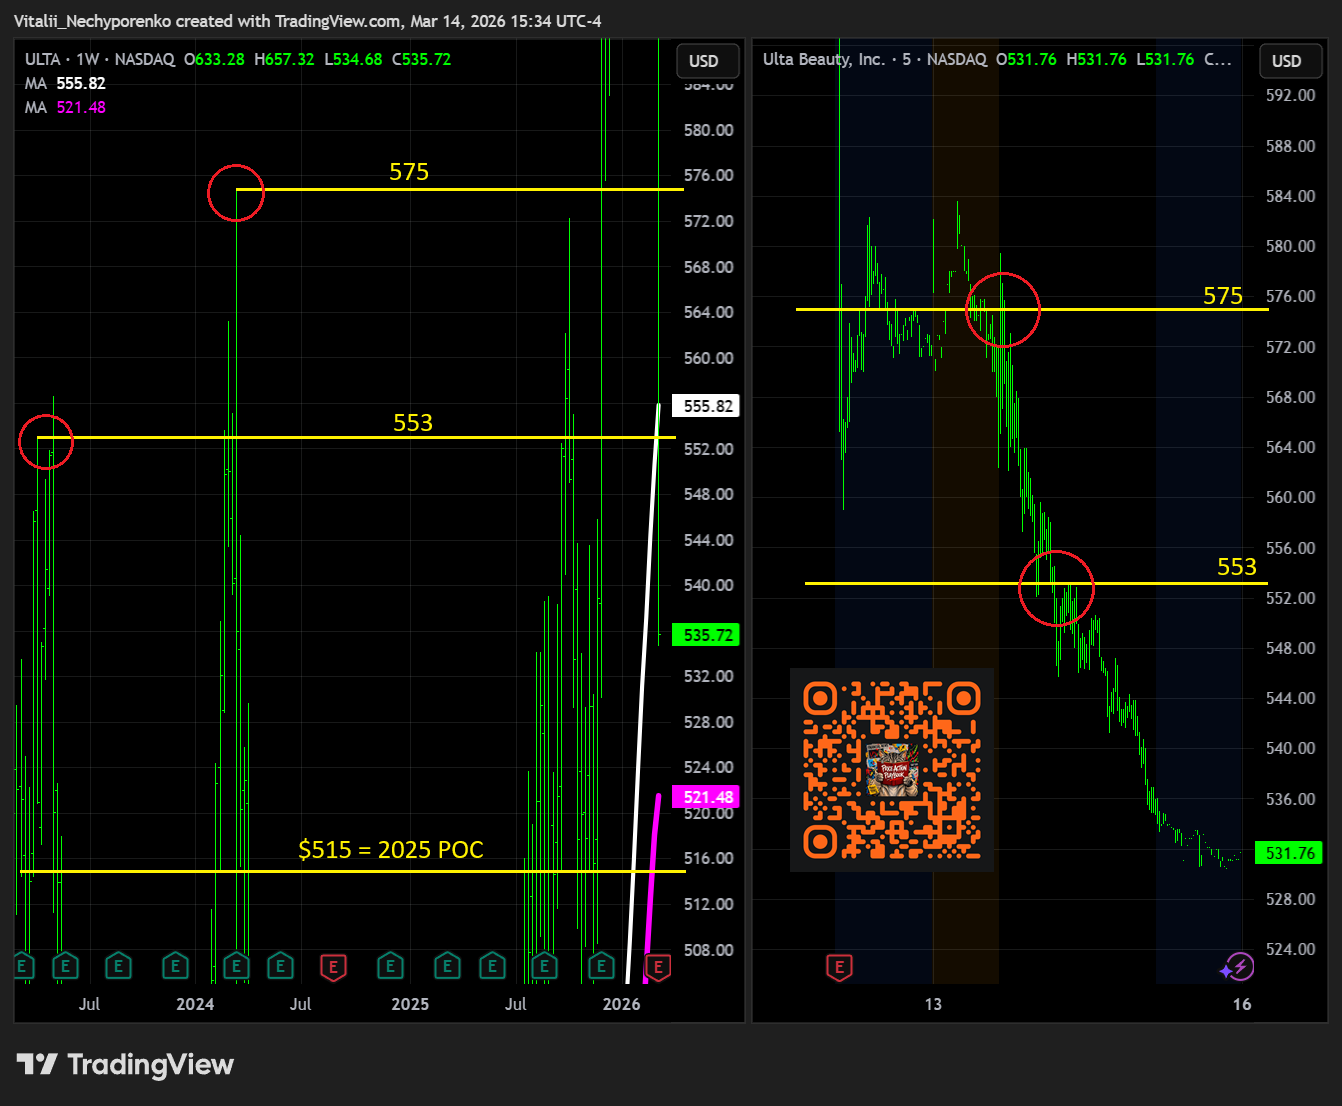
Ulta Beauty reported mixed Q4 results as modest revenue upside and solid comparable sales were overshadowed by a rare EPS miss and softer forward guidance. Comparable sales increased 5.8% YoY, slightly below the 6.3% posted in the prior quarter, driven by a 4.2% rise in average ticket and a 1.6% increase in transactions, with demand supported by a strong holiday season and easier comparisons following last year’s January softness. Fragrance remained the strongest category with double digit growth fueled by launches from brands such as YSL and Prada alongside exclusive offerings including Noyz, Snif, and Summer Mink by Drake, while haircare delivered its best performance of the year with high single digit growth and makeup posted low single digit gains with share expansion across both mass and prestige segments. Operating margin declined to 12.2% from 14.8% a year earlier as SG&A expenses increased 23% YoY driven by higher corporate overhead, increased advertising spending, and incentive compensation tied to strategic investments. Looking ahead the company guided FY27 comparable sales to grow 2.5-3.5%, a noticeable slowdown from the 5.4% posted in FY26, while also issuing EPS guidance below analyst expectations as investors weigh moderating growth and margin pressure despite still solid demand trends across core beauty categories.
In the latest Weekly Playbook I highlighted 575-612 as key support areas, though I later shifted those to 553 and 575 respectively given the proximity to the first zone. The 575 level is the old weekly pivot high, with a couple of Fib retracement targets also aligning around that area. The 553 level is another prior weekly high with the 200d adding further significance. After a clear rejection at 575 sellers took full control, and the 553 area was flipped and backtested beautifully as well. With the 2025 POC around 515 we might see a reaction there sooner rather than later.
4. Earnings to Watch This Week
In this section I share the clean charts highlighting only key zones used for planning and execution. I use fully layered charts to identify them, but keep the charts here clean for clarity. All levels reflect Friday’s close, though much can change between Monday’s open and the actual earnings release. If a key support or resistance zone is reached or broken beforehand, I’ll shift to the next level and update accordingly. Those updates often go out without charts, either in the morning note or the pre-EPS AMC note, and I base my execution on the revised levels. So if you notice differences between the weekend write-up and later updates, that’s intentional.
Monday
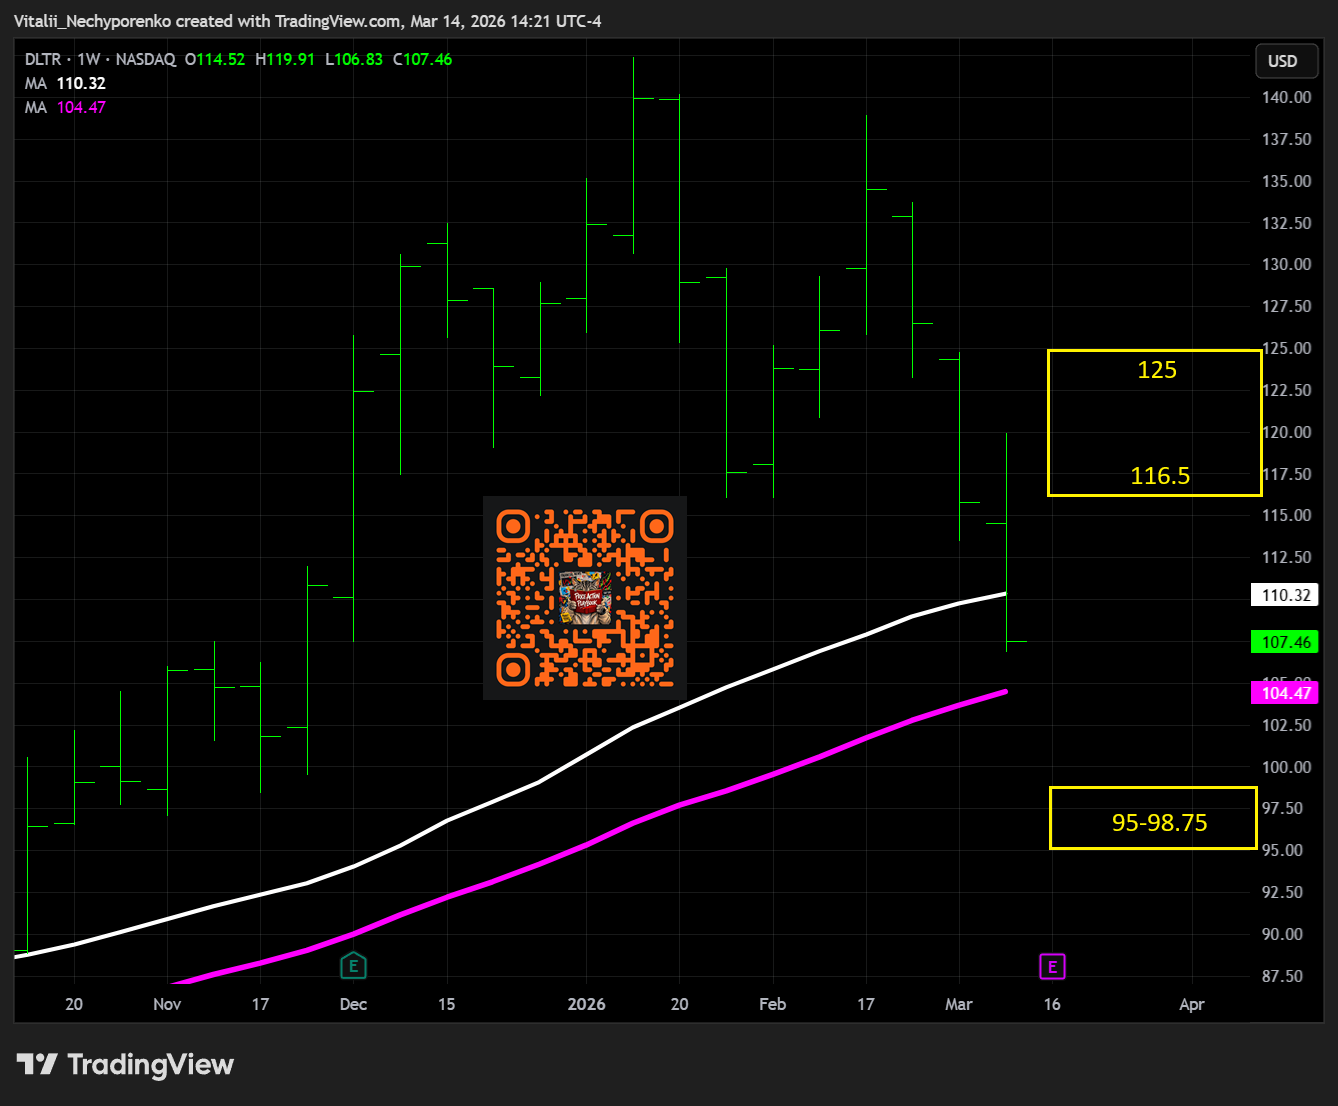
DLTR Before Market Open
Turnover: $0.3 billion
Support: $95-98.75 (Projected move to support: -8.11%)
Resistance: $116.5-125 (Projected move to resistance: +8.41%)
Tuesday
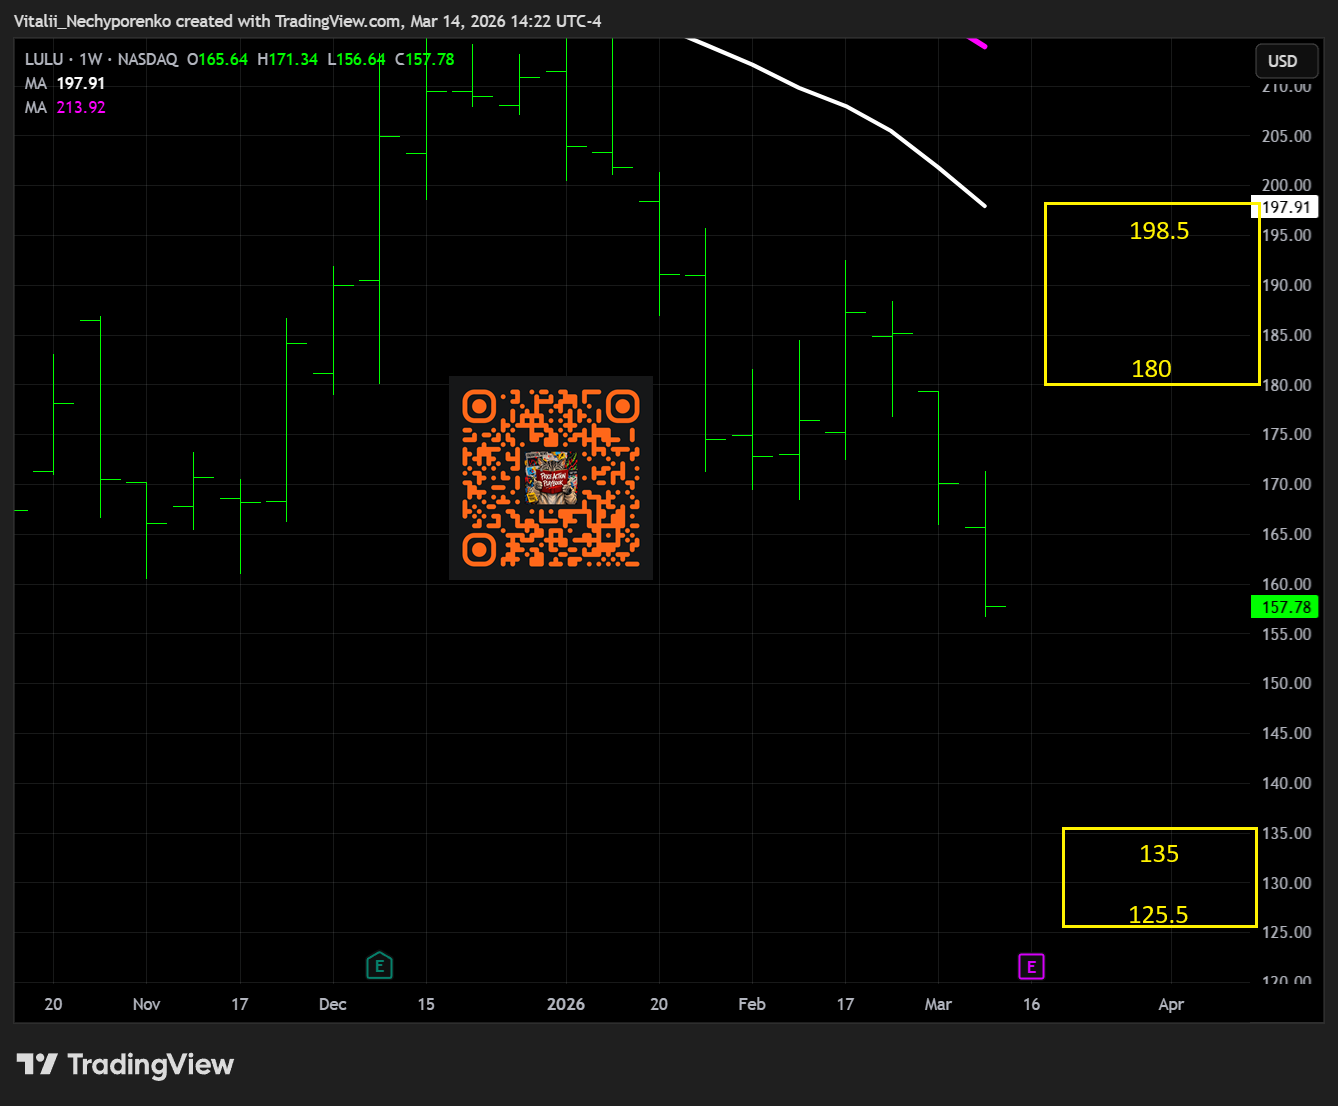
LULU After Market Close
Turnover: $0.4 billion
Support: $125.5-135 (Projected move to support: -14.44%)
Resistance: $180-198.5 (Projected move to resistance: +14.08%)
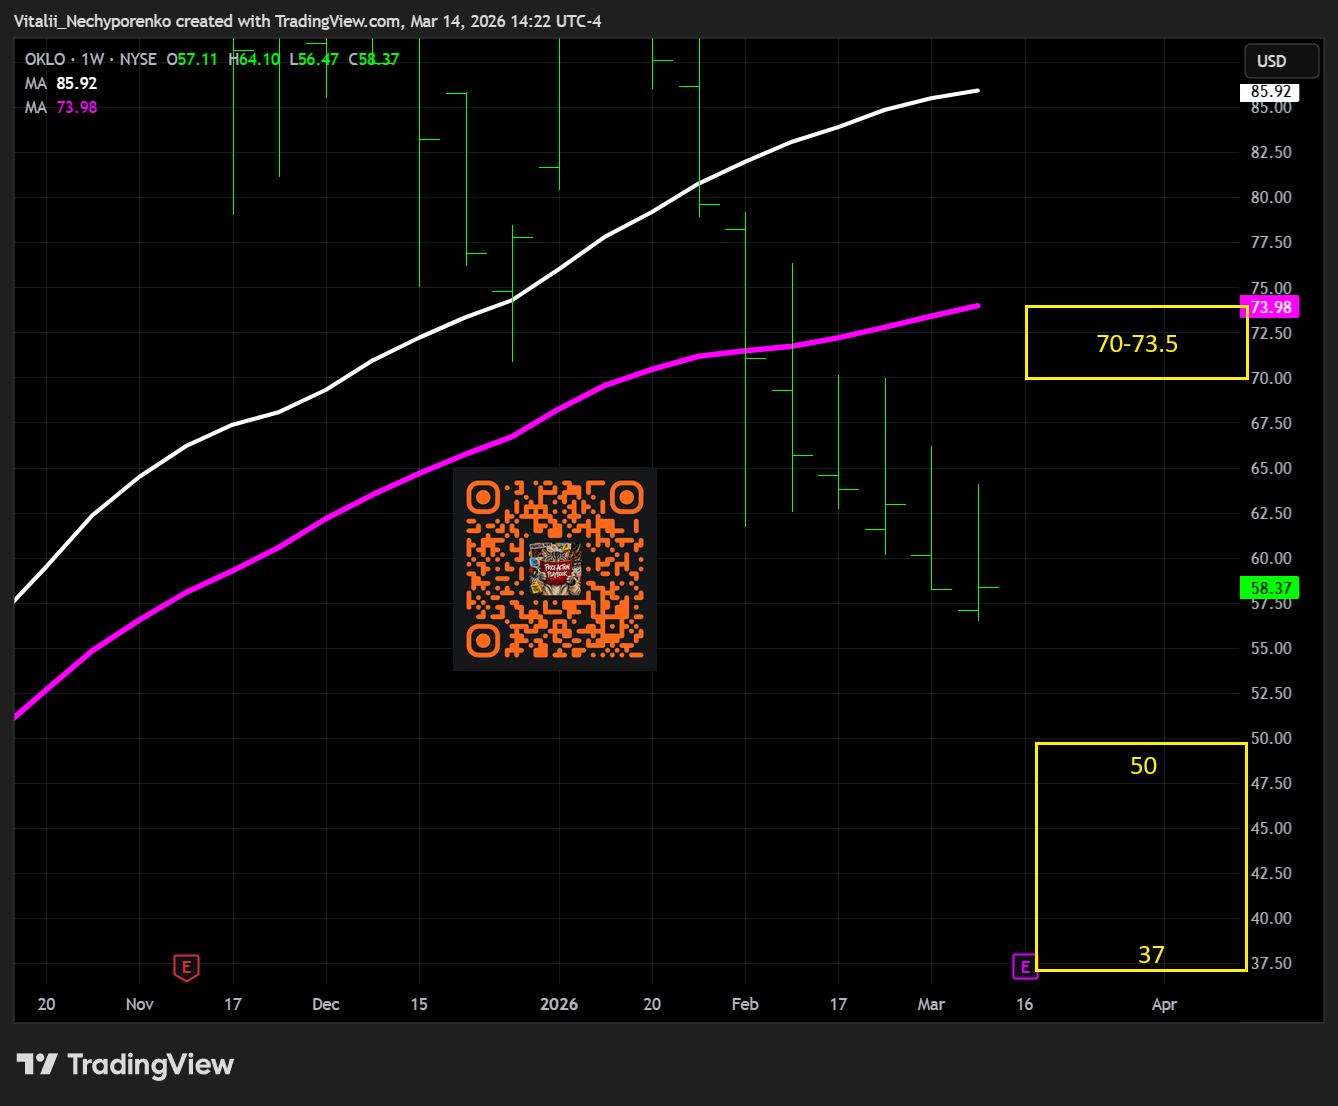
OKLO After Market Close
Turnover: $0.5 billion
Support: $37-50 (Projected move to support: -14.34%)
Resistance: $70-73.5 (Projected move to resistance: +19.92%)
Wednesday
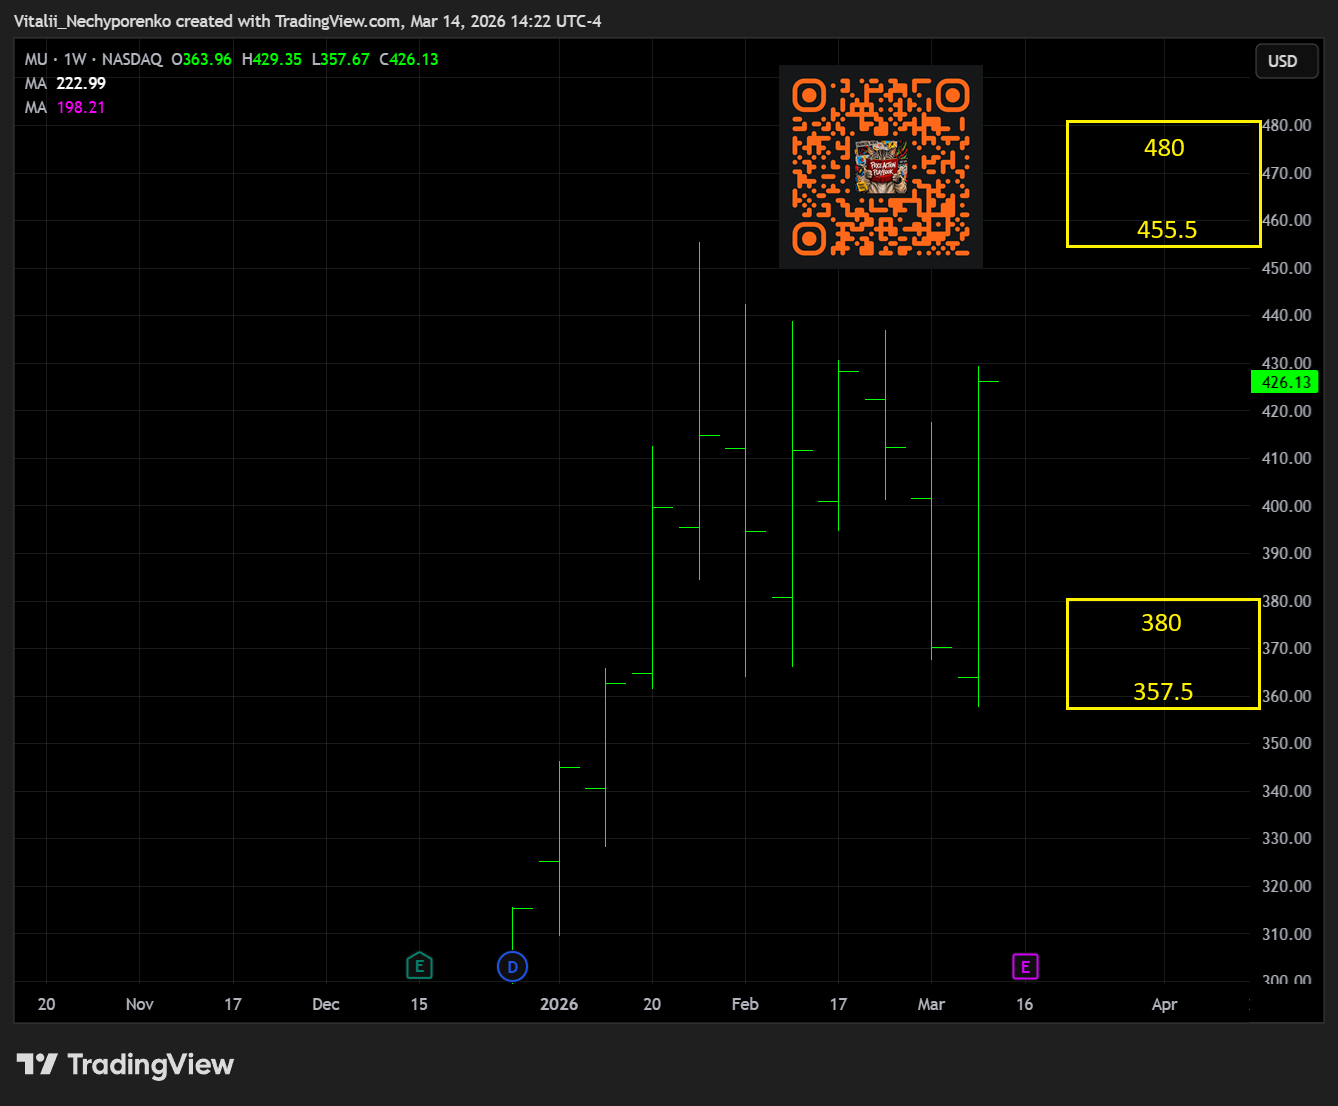
MU After Market Close
Turnover: $14.9 billion
Support: $357.5-380 (Projected move to support: -10.83%)
Resistance: $455.5-480 (Projected move to resistance: +6.89%)
Thursday
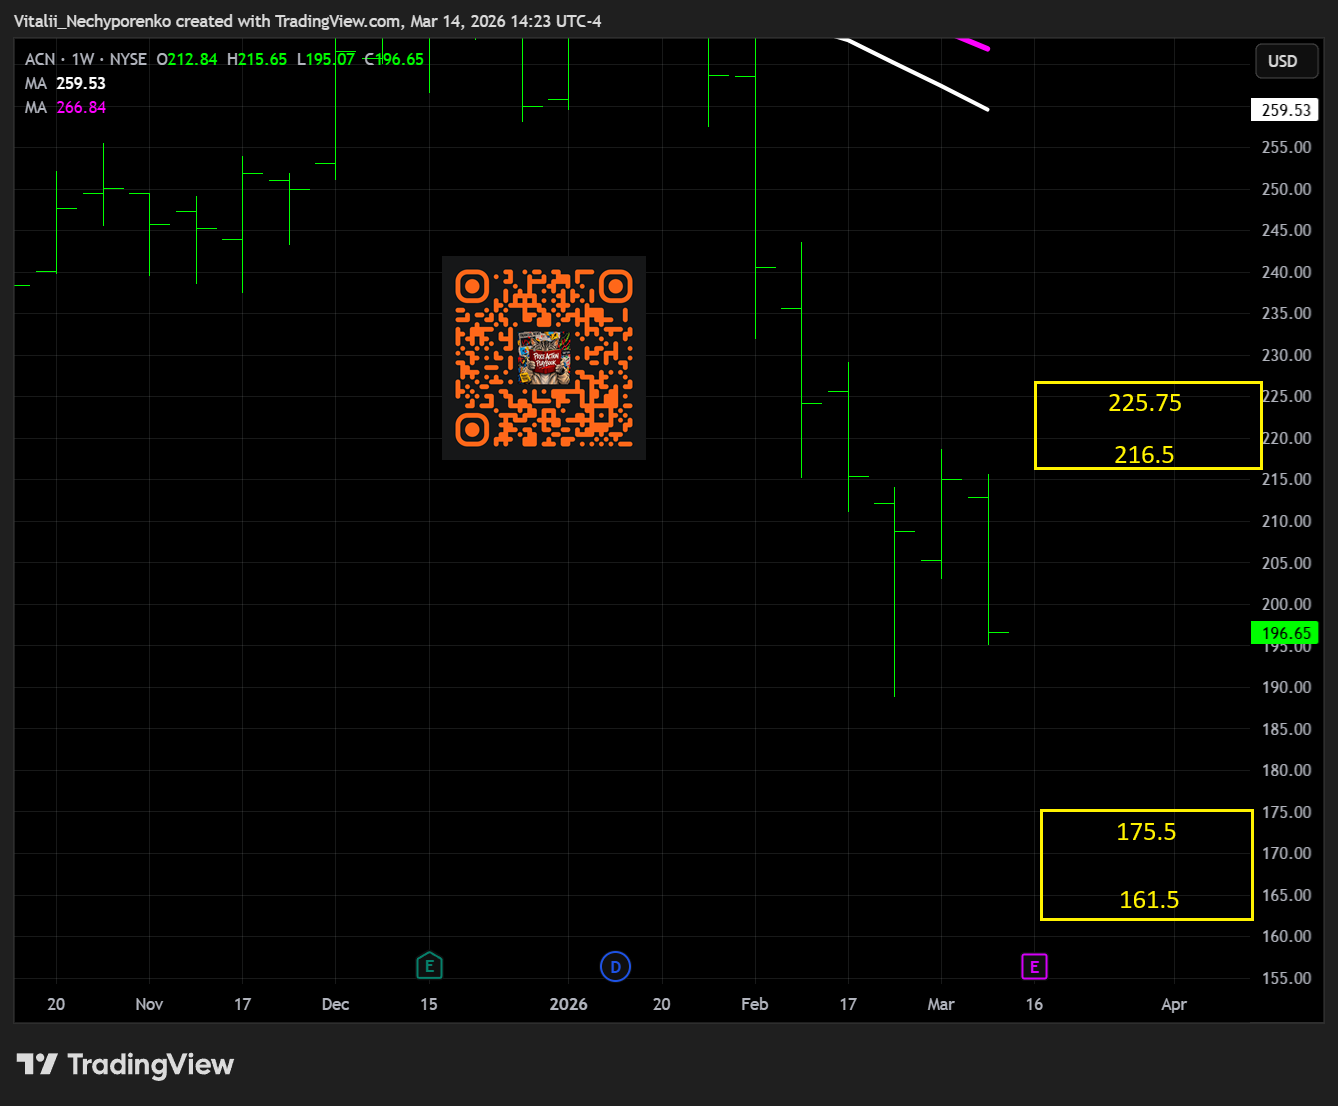
ACN Before Market Open
Turnover: $1.4 billion
Support: $161.5-175.5 (Projected move to support: -10.76%)
Resistance: $216.5-225.75 (Projected move to resistance: +10.09%)
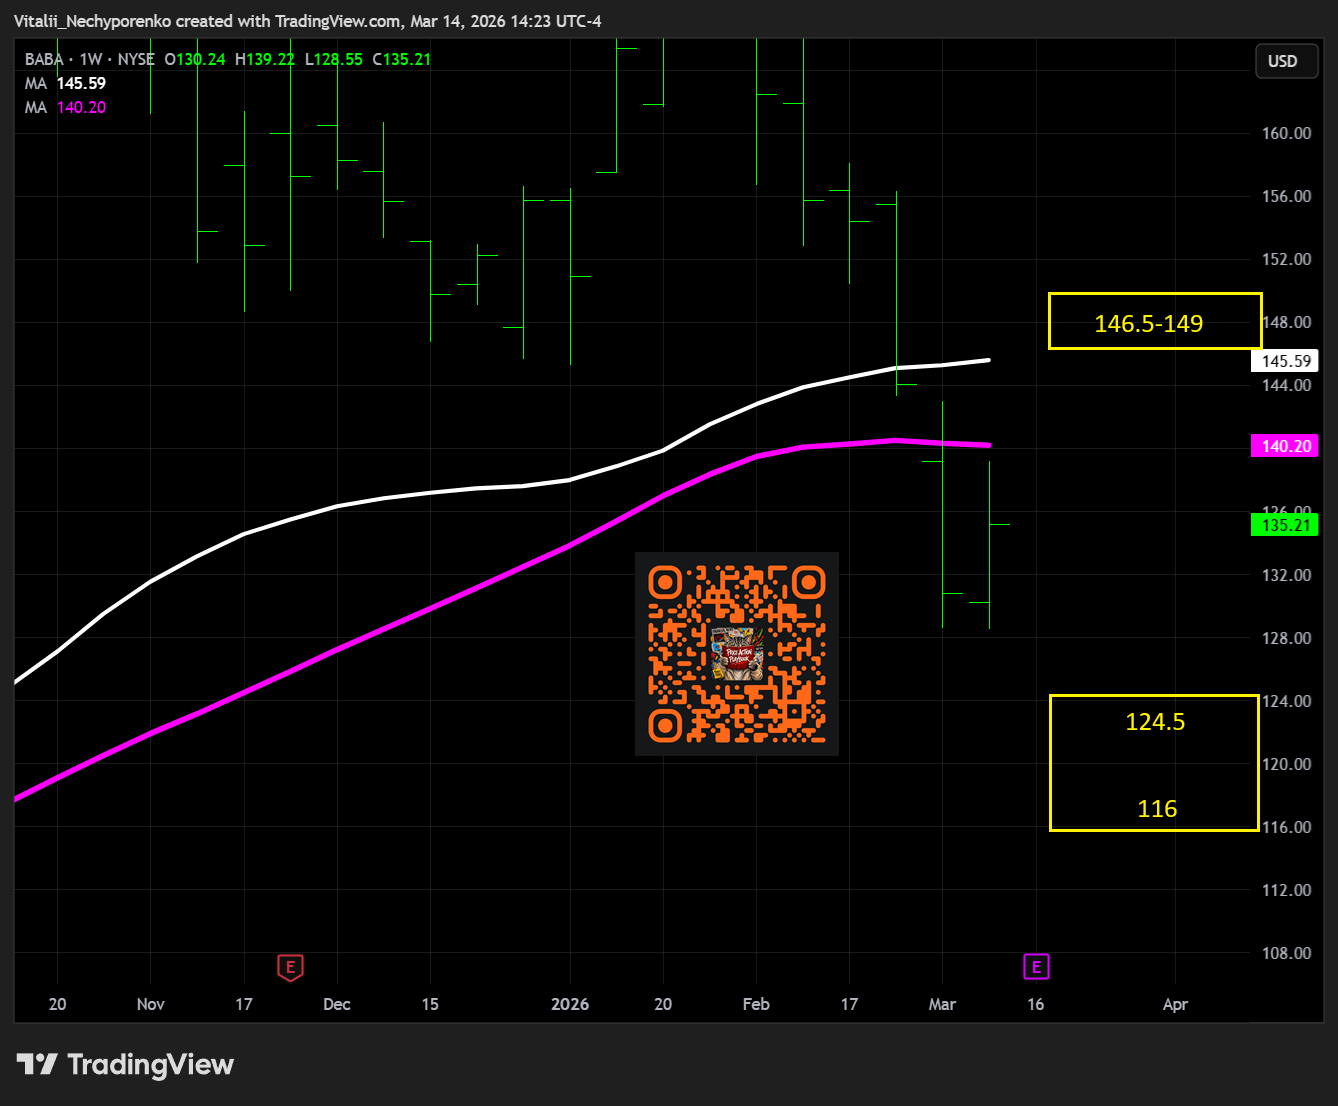
BABA Before Market Open
Turnover: $1.4 billion
Support: $116-124.5 (Projected move to support: -7.92%)
Resistance: $146.5-149 (Projected move to resistance: +8.35%)
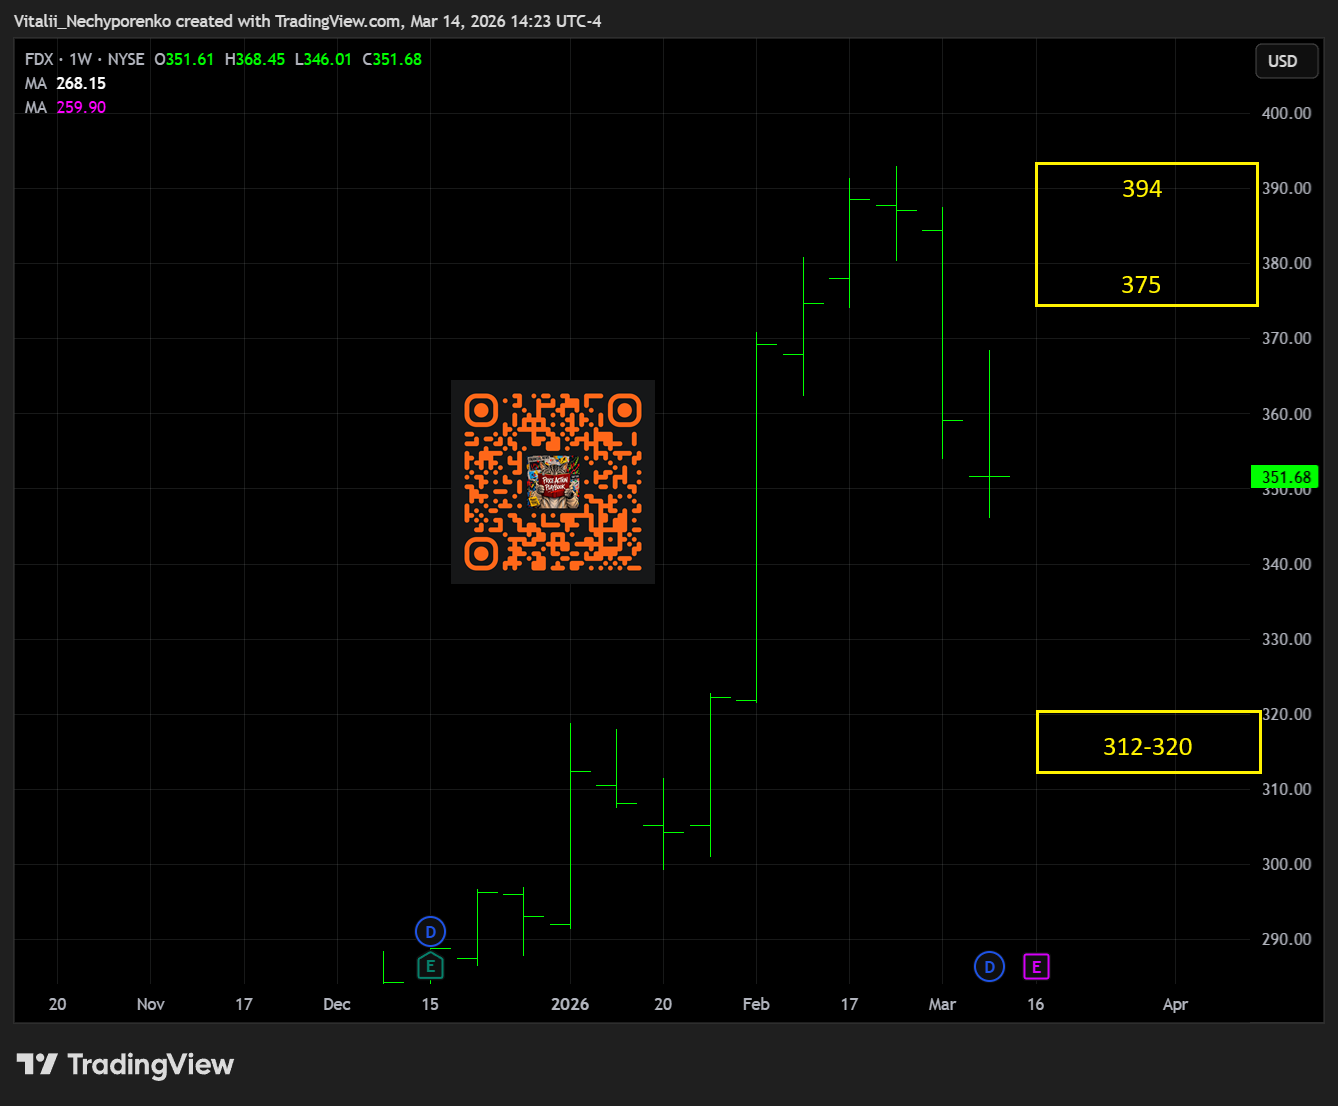
FDX After Market Close
Turnover: $0.7 billion
Support: $312-320 (Projected move to support: -9.01%)
Resistance: $375-394 (Projected move to resistance: +6.63%)
Disclaimer:
This report is intended solely for informational and educational purposes and reflects independent commentary and analysis by the author. The author is not affiliated with any company mentioned in this report and holds no positions on the board of any related entities. All opinions, analyses, and insights expressed are the author’s alone and should not be interpreted as specific investment advice, a solicitation to buy or sell securities, or an endorsement of any particular investment strategy.The information provided is derived from sources and research the author deems reliable, but its accuracy, completeness, or timeliness is not guaranteed. Readers should not rely on this report as the sole basis for any financial decisions. The author disclaims any liability to update or revise the content as new information becomes available.
Investing involves significant risks, including the potential for loss of principal. Past performance does not guarantee future results. Investments or strategies discussed may not suit every individual’s circumstances, and they may fluctuate in price or value. This report does not consider your specific financial objectives, risk tolerance, or personal investment needs. Readers are encouraged to conduct their own research and consult with a qualified financial or investment advisor before making any investment decisions.
The author and any associated entities do not guarantee specific outcomes or profits from the use of this report. The author may or may not hold open positions in the securities mentioned. By reading this report, you acknowledge the risks involved and accept the limitations of the information presented.