


Table of Contents
Market Overview
Earnings to Watch This Week: NKE
Research Unpacked: SPCX, FDX, CBRS, MU and ON
1. Market Overview
Russell Reconstitution is behind us. For those who have been following the Playbook for a while, you already know this is one of the market mechanics events I look forward to every year.
Starting this year, FTSE Russell officially transitioned to a semi annual reconstitution schedule. June remains the primary rebalance, but December now joins the calendar as well, effectively doubling the number of major index reshuffles each year. Whether you choose to trade those events or simply observe them is entirely up to you. Understanding how they work, however, is becoming increasingly difficult to ignore.
For anyone interested in the mechanics behind the process, last year's dedicated Russell Playbook remains available below:
Unraveling the Close: The Russell Reconstitution and Its Final Minutes

Welcome to the special edition of weekly writeup dedicated to the Russell Reconstitution and the basics on closing auction imbalances!
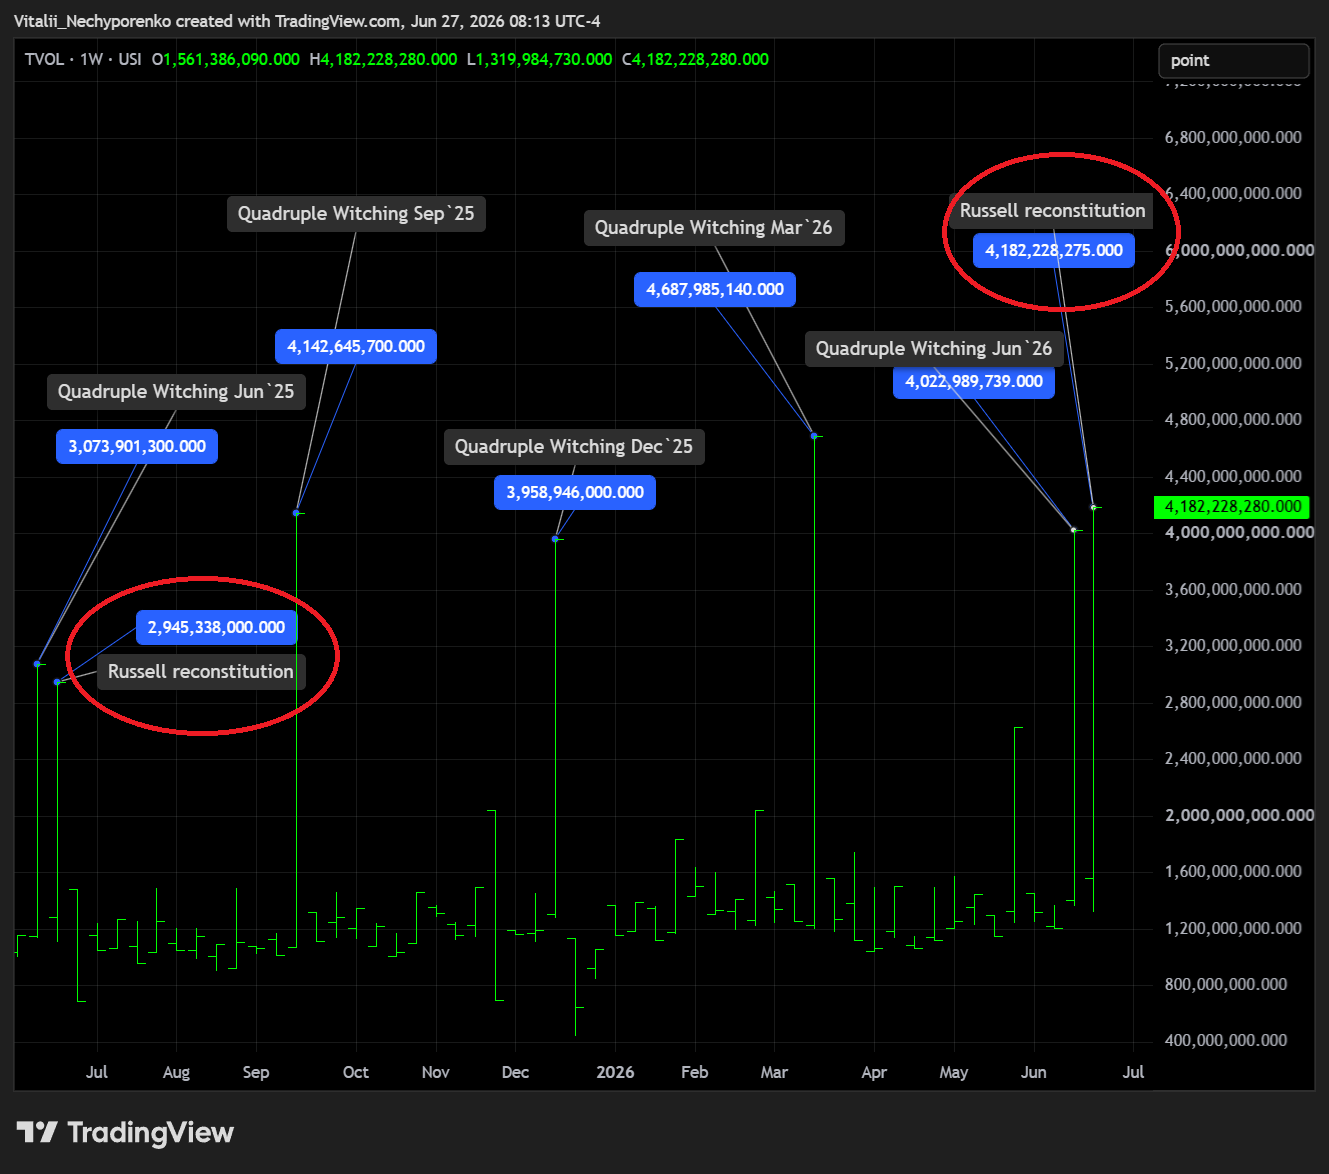
Here is the NYSE total volume chart. As you can see, total auction volume increased by more than 40% year over year, a remarkable jump considering the transition to a semi annual schedule.
That said, last year the most interesting dislocations came from the Nasdaq side:
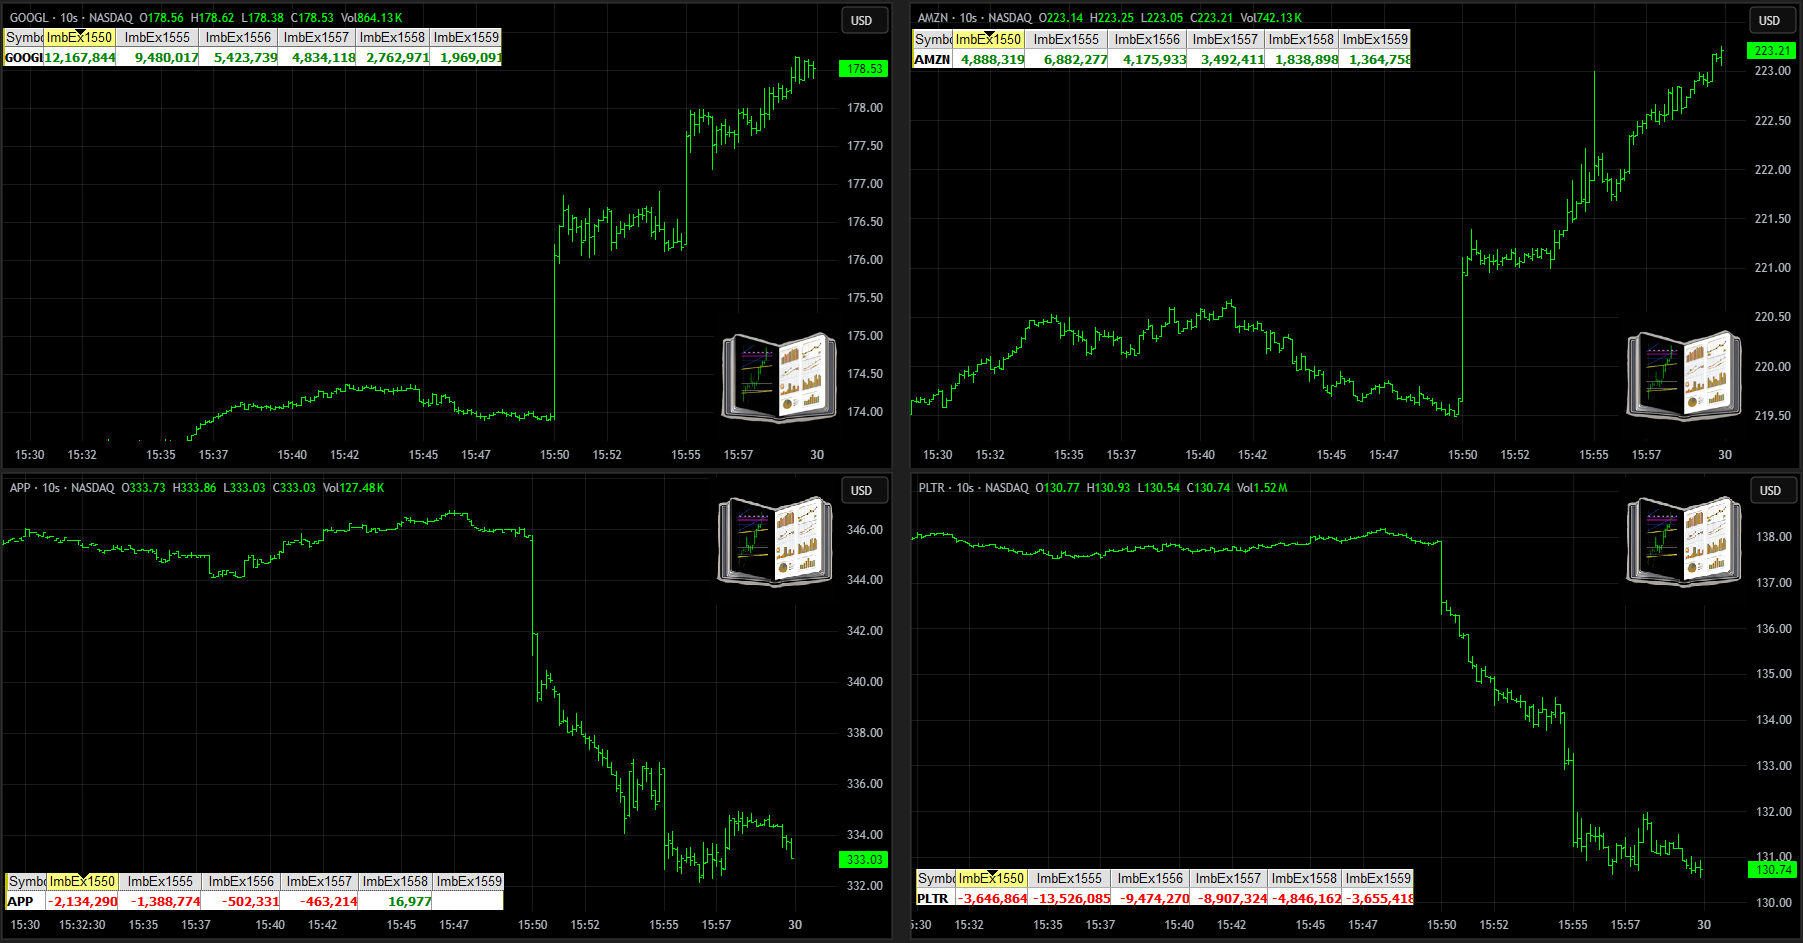
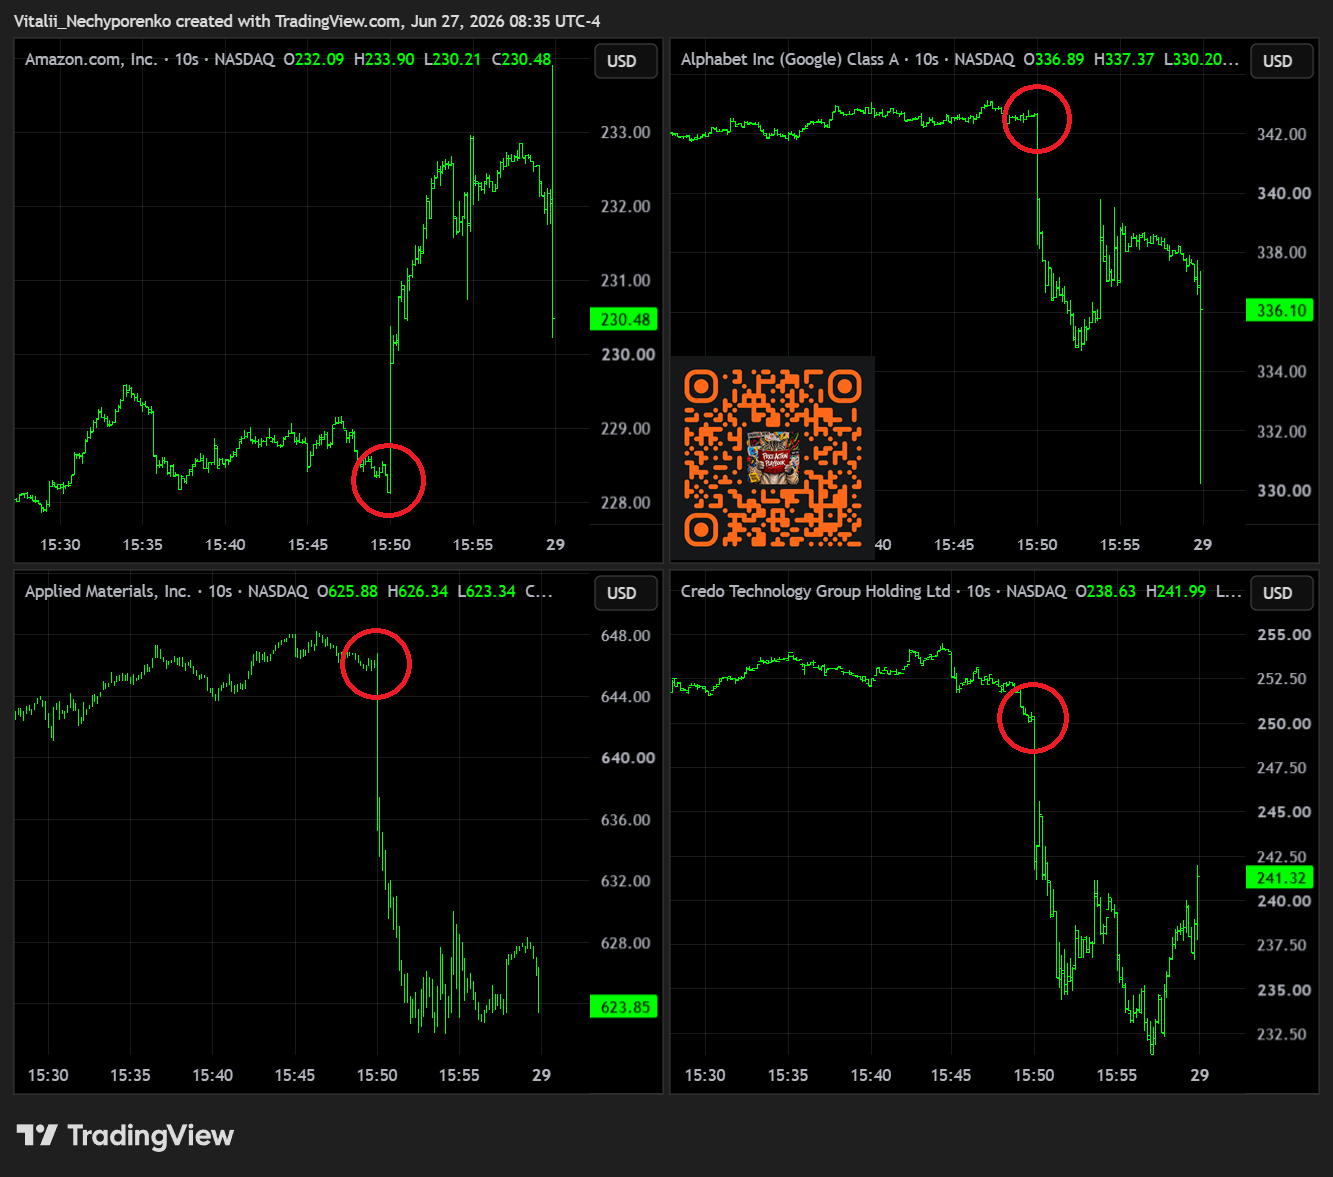
This time though, apart from a handful of notable names such as AMZN, GOOGL, AMAT, CRDO, and a collection of thinly traded biotechs, there were enormous paired volumes and surprisingly few imbalances exceeding even $1B in notional value.
That brings us to one of the biggest misconceptions surrounding closing auctions:
It is not about imbalance size.
It is about how much of that imbalance actually survives into the Closing Cross.
The perfect example was BE, a true NYSE beast:
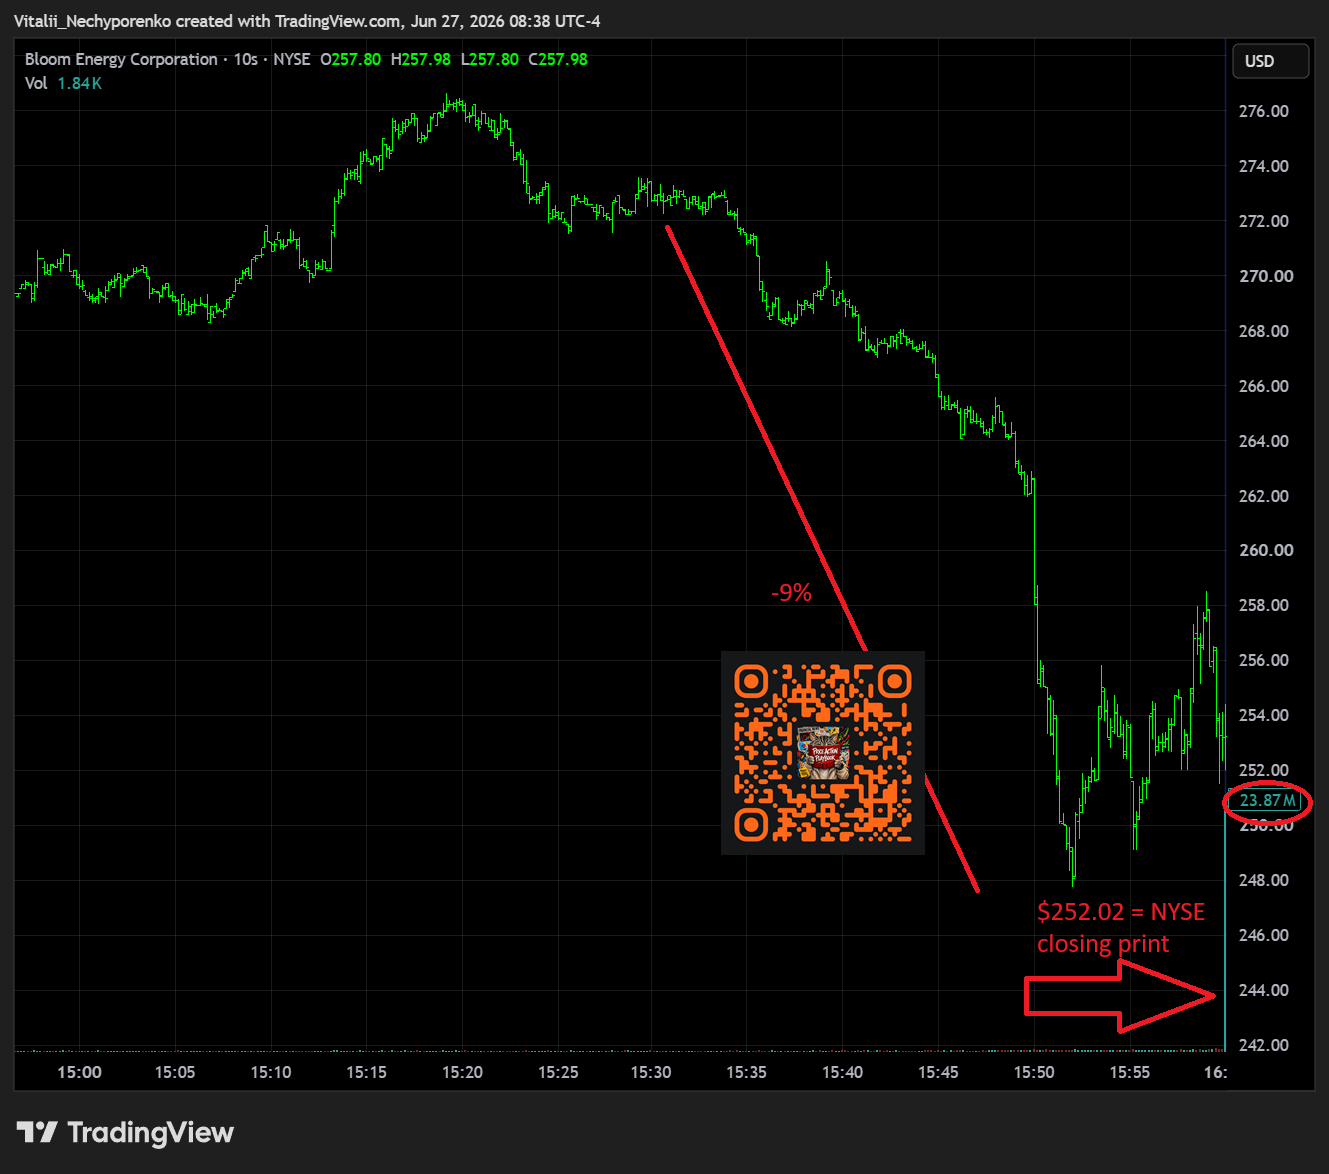
With roughly $3 billion of early floor imbalance, the stock briefly became one of the most closely watched names on the tape, falling nearly 9% within thirty minutes before the auction eventually absorbed the remaining flow.
Next stop: December. Stay tuned, and more importantly, prepared.
And since we're currently #14 Rising in Crypto, it would be just wrong not to mention Bitcoin here. I'll leave the narratives to everyone else and let this weekly chart tell its own story:
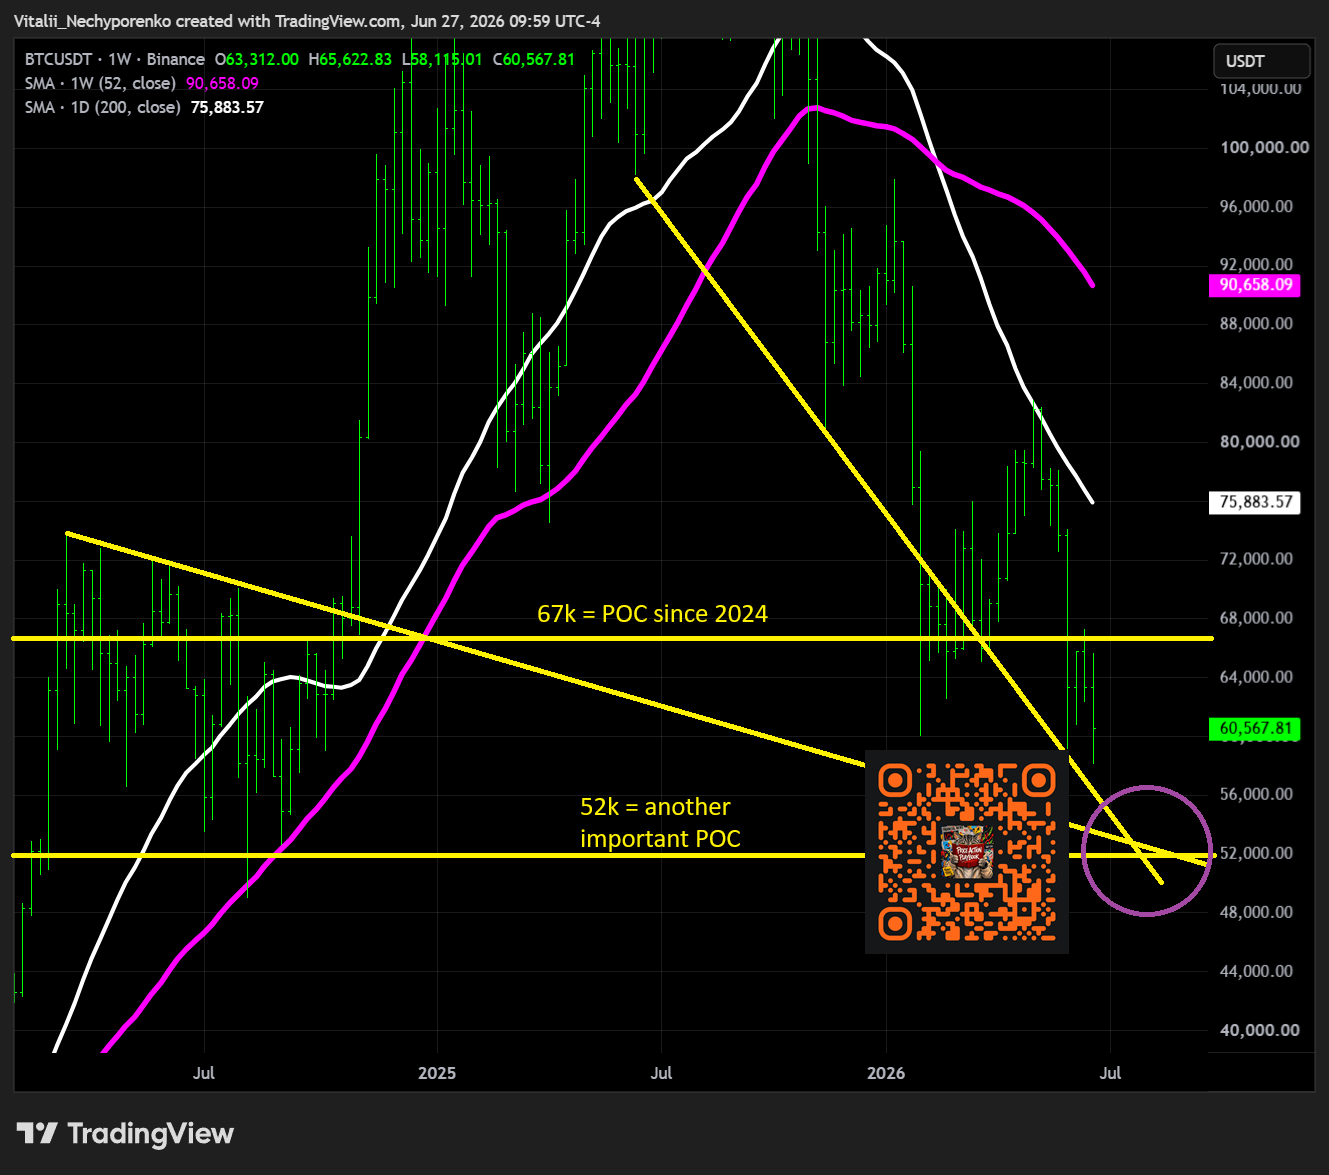
What’s next? A holiday shortened week. After that, attention gradually shifts toward the next major catalyst: Earnings season is just around the corner.
2. Earnings to Watch This Week
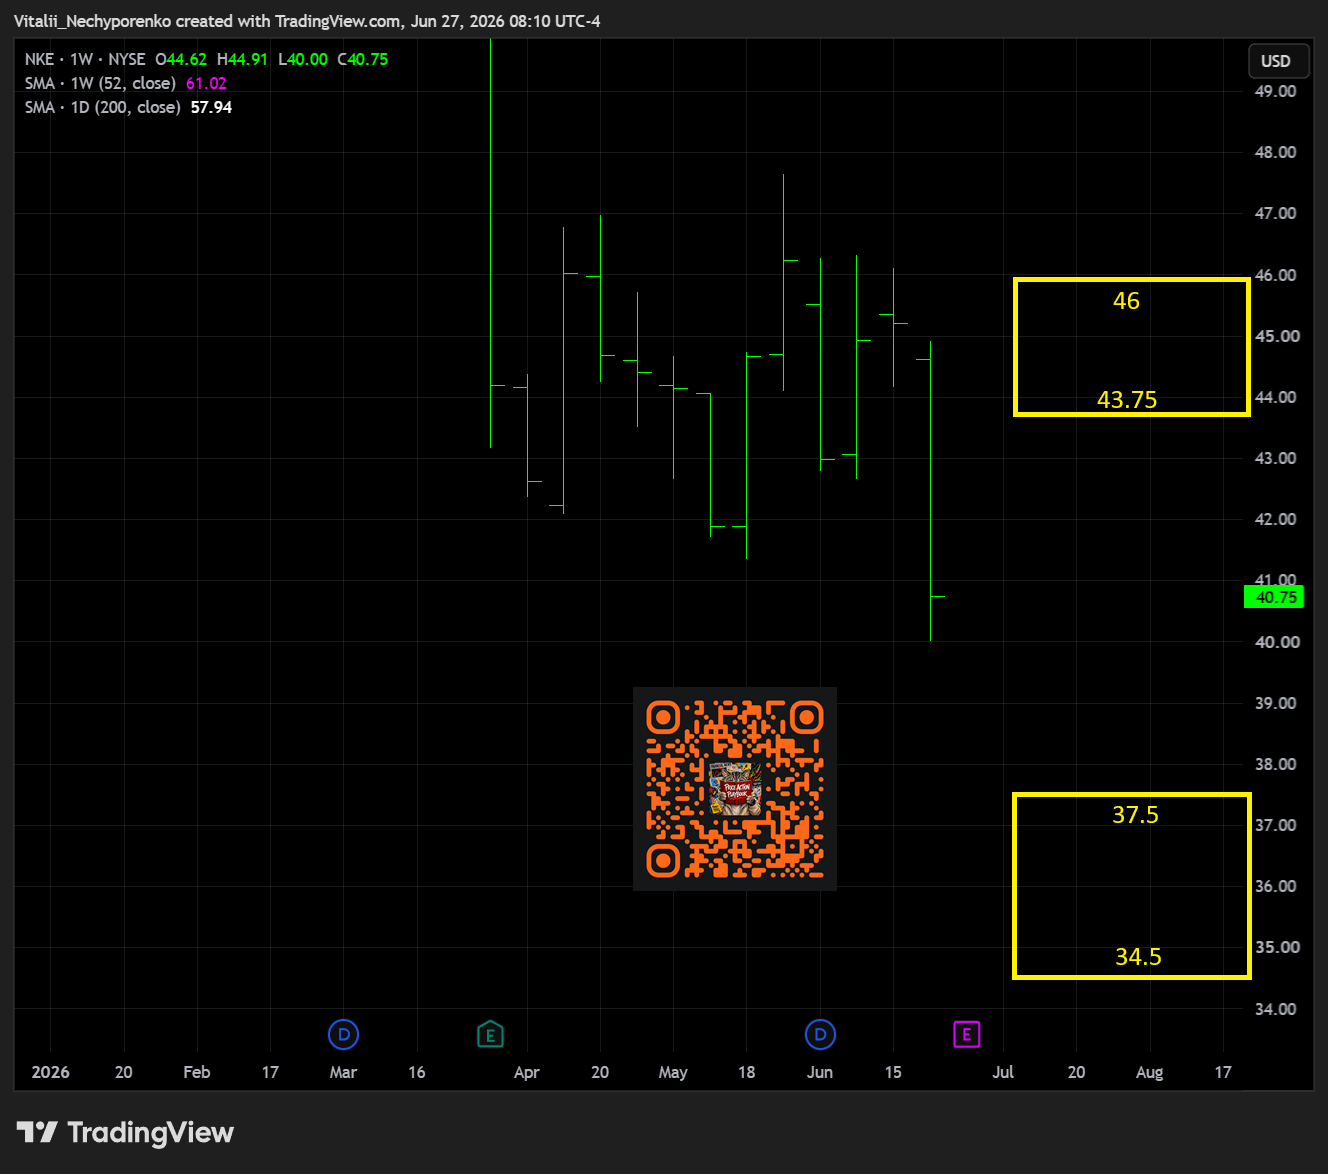
In this section I share clean charts highlighting only the key areas used for planning and execution. The levels are identified using fully layered charts, but are presented here without the extra clutter.
All levels reflect Friday’s close and serve as a roadmap rather than a prediction. If a key area is in play before earnings, the focus shifts to the next relevant zone.
That’s not inconsistency. That’s price action.
Tuesday
NKE
EPS Timing: After Market Close
Turnover: $0.9 billion
Support: $34.5-37.5 (Projected move to support: -7.98%)
Resistance: $43.75-46 (Projected move to resistance: +7.36%)
3. Research Unpacked
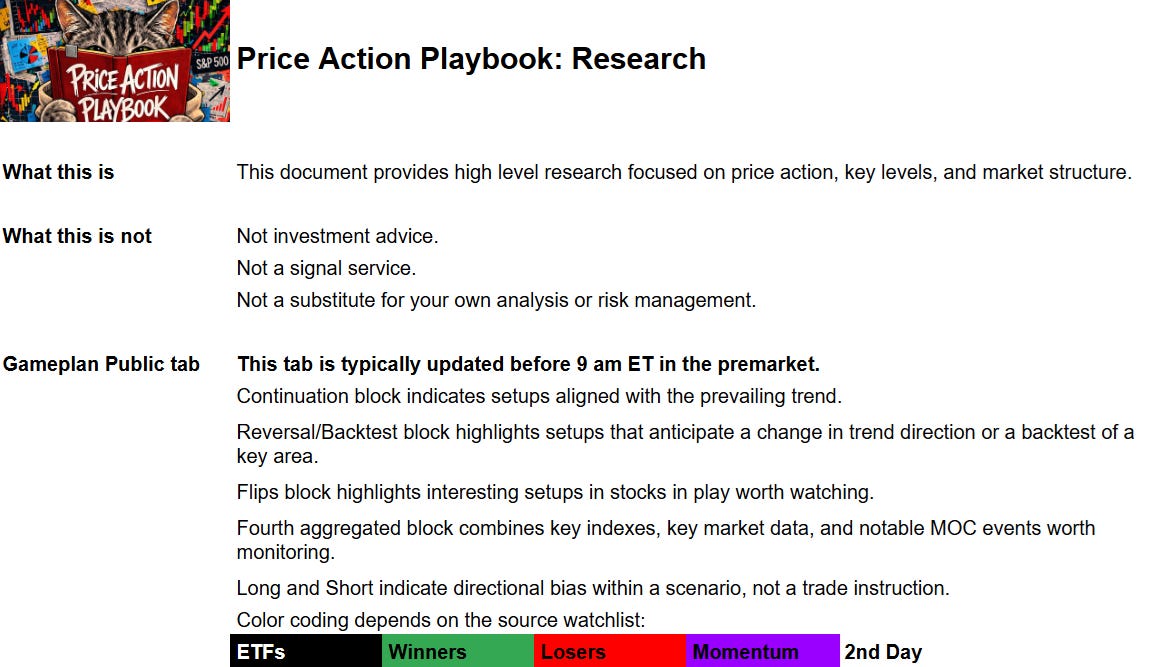
Below is this week’s Price Action Playbook: Research dump
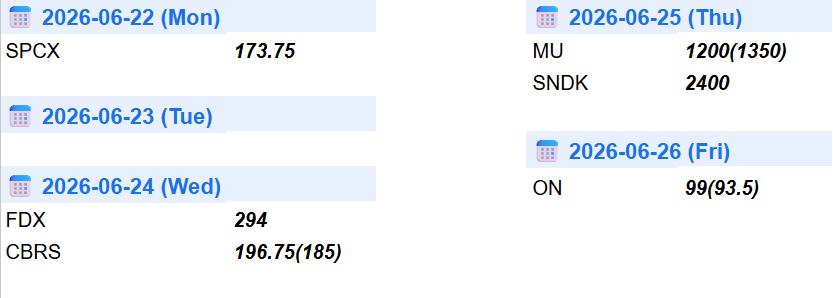
Let’s look at the logic behind some of those areas:
SPCX 173.75
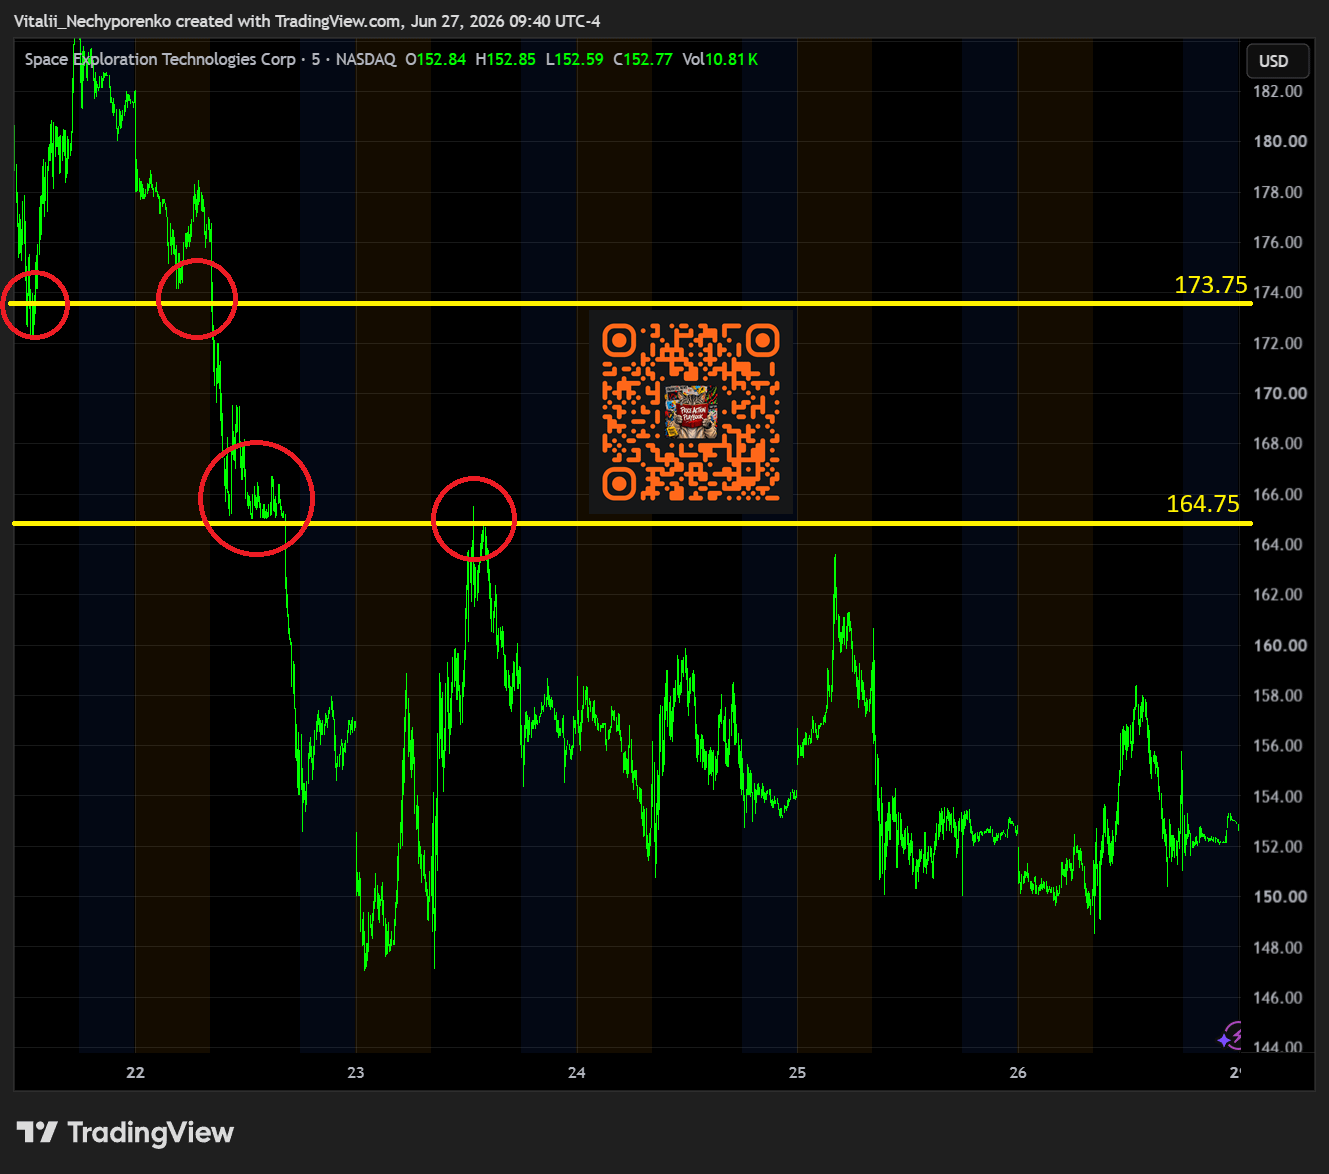
I think the importance of this one has been highlighted more than enough. The way it broke deserves a technical beauty award, though the following breakdown of 164.75 might challenge that.
As you already know, nothing good usually happens below an all-time POC. Nasdaq 100 inclusion remains on watch, but given the recent tape, the appointment with the IPO price is already scheduled. Let’s see if bulls can reclaim at least 164.75, preferably both levels, to cancel it, although the cancellation fee might already be too high.