


Table of Contents
Market Overview
Key Index Charts
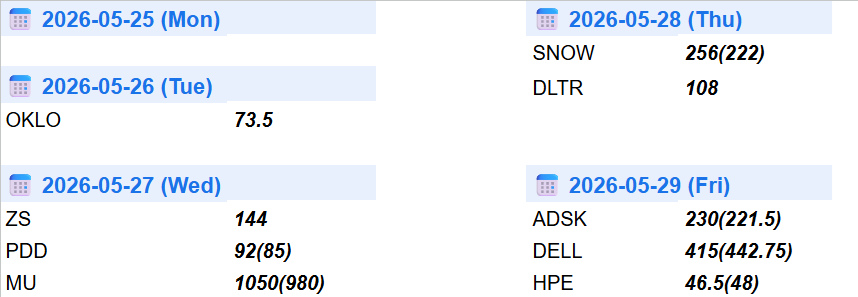
Earnings & Interesting Movers Recap: OKLO, ZS, PDD, MU, SNOW, DLTR, ADSK and DELL
Earnings to Watch This Week: HPE, CRDO, PANW, MDT, AVGO, CRWD and CIEN
1. Market Overview
Another May is in the books, and once again the old market proverb failed to age particularly well. Much like a steak, there comes a point where aging stops adding value and starts attracting unwanted attention.
At this point, anyone who sold in May is probably praying for a pullback, a retest, or simply another opportunity to buy back what was sold a little too early. Those who decided to sell short instead are likely praying even harder.
In fact, after the last couple of months, a holiday-shortened week might be the only short that has consistently worked in this market.
The problem is that this bull has shown remarkably little interest in granting second chances. Every dip has been bought, every scare has been absorbed, and every attempt to call the top has looked brilliant for somewhere between a few hours and a few days.
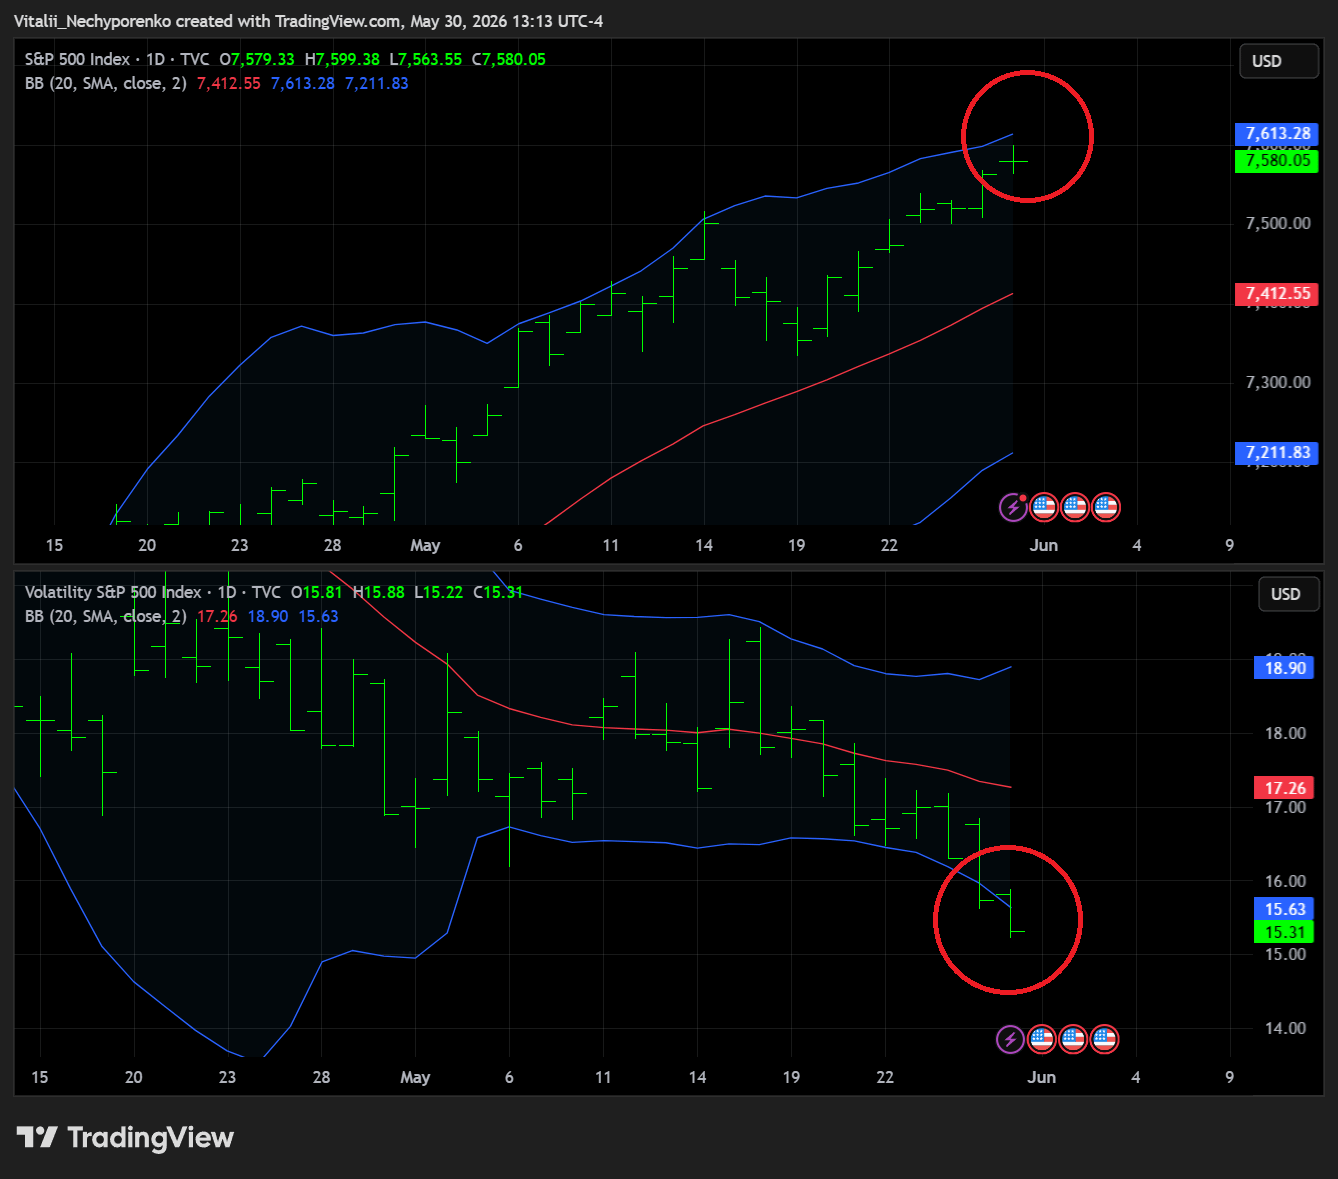
The funny thing is that bears are not entirely out of ammunition. In fact, they may be about to receive something worth paying attention to. Another VIX signal is slowly brewing, and this time we have a decent chance to get a full sequence, with VIX already closing below the lower band twice in a row.
It might be worth waiting for SPX before getting your boarding pass ready, though.
That said, signals remain probabilities, not predictions. Plenty of things were supposed to stop this market already. All of them failed.
And while plenty of folks remain focused on whether volatility is finally preparing to wake up, where inflation is headed, and whether the Fed will deliver a hike or two, Friday’s close delivered a much more immediate reminder that markets are increasingly driven by mechanics as much as by narratives.
The MSCI rebalance once again produced significant dislocations, unusual volume, and some beautiful price action for those willing to pay attention. These events continue to move real money and create real opportunities regardless of the headlines, P/E ratios, and many of the other things people tend to debate in the world of finance.
Meanwhile, the market doesn’t particularly care what people are debating. It still has orders to execute.
And this is only the beginning.
For those interested in the detailed mechanics, here is a Russell Reconstitution breakdown written almost a year ago:
Unraveling the Close: The Russell Reconstitution and Its Final Minutes

Welcome to the special edition of weekly writeup dedicated to the Russell Reconstitution and the basics on closing auction imbalances!
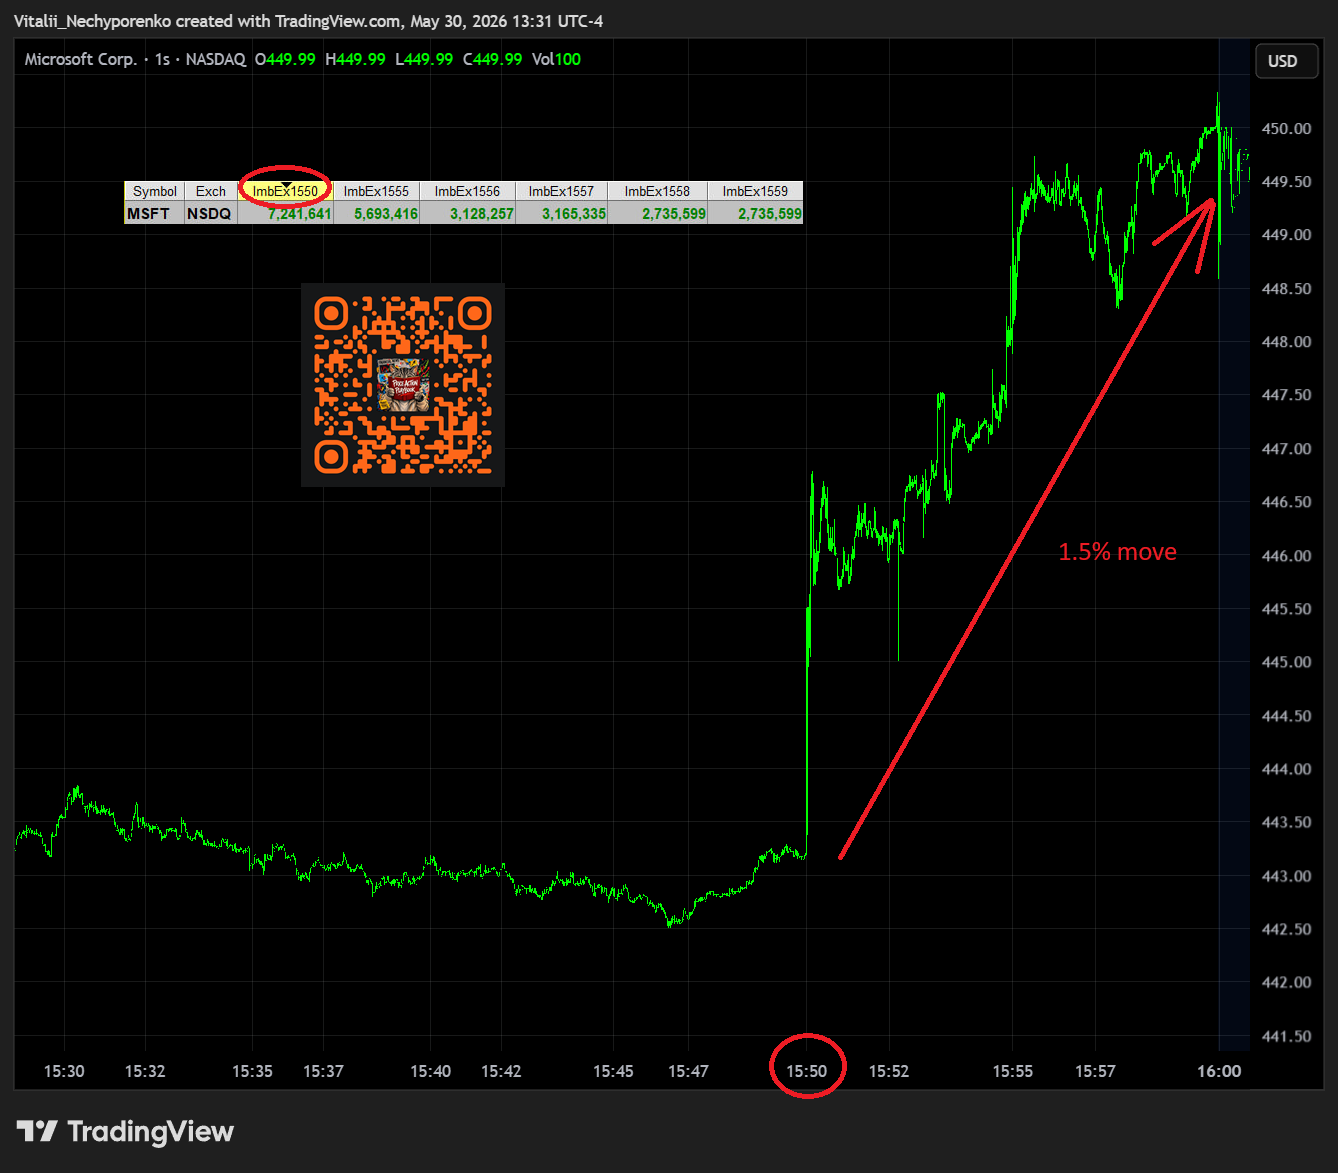
So here comes Microsoft with a 7.2 million share Nasdaq buy imbalance, translating to around $3.2 bln in notional and a 1.5% move in 10 minutes:
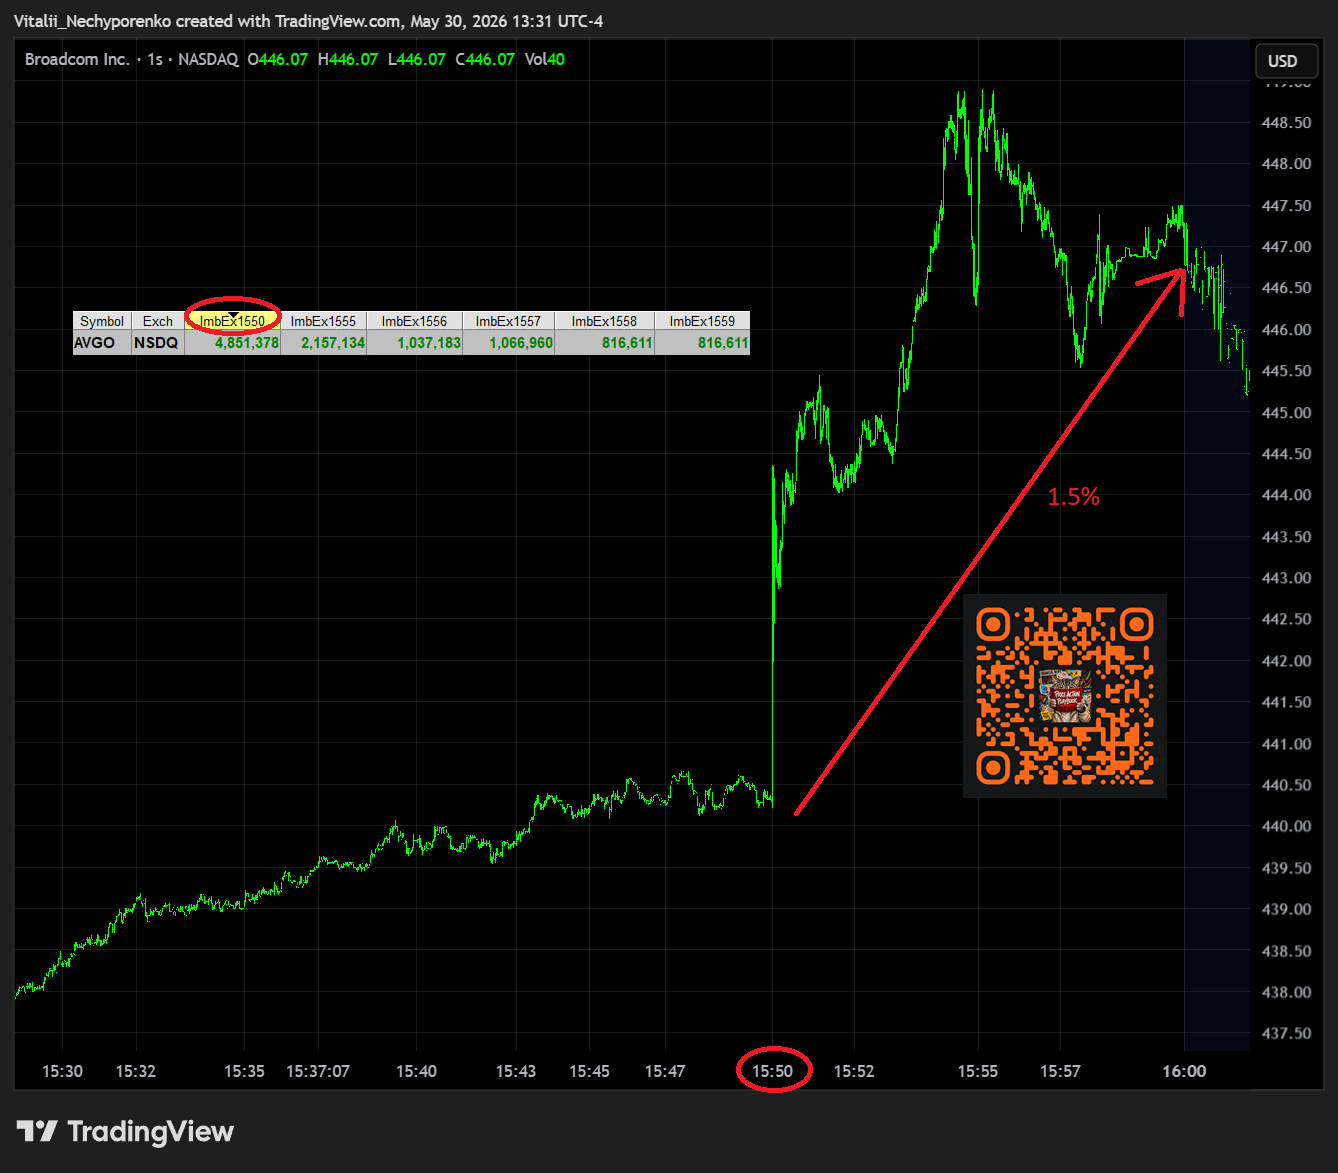
Broadcom follows with a move of similar magnitude on a 4.8 million share Nasdaq buy imbalance, or roughly $2.1 bln in notional.
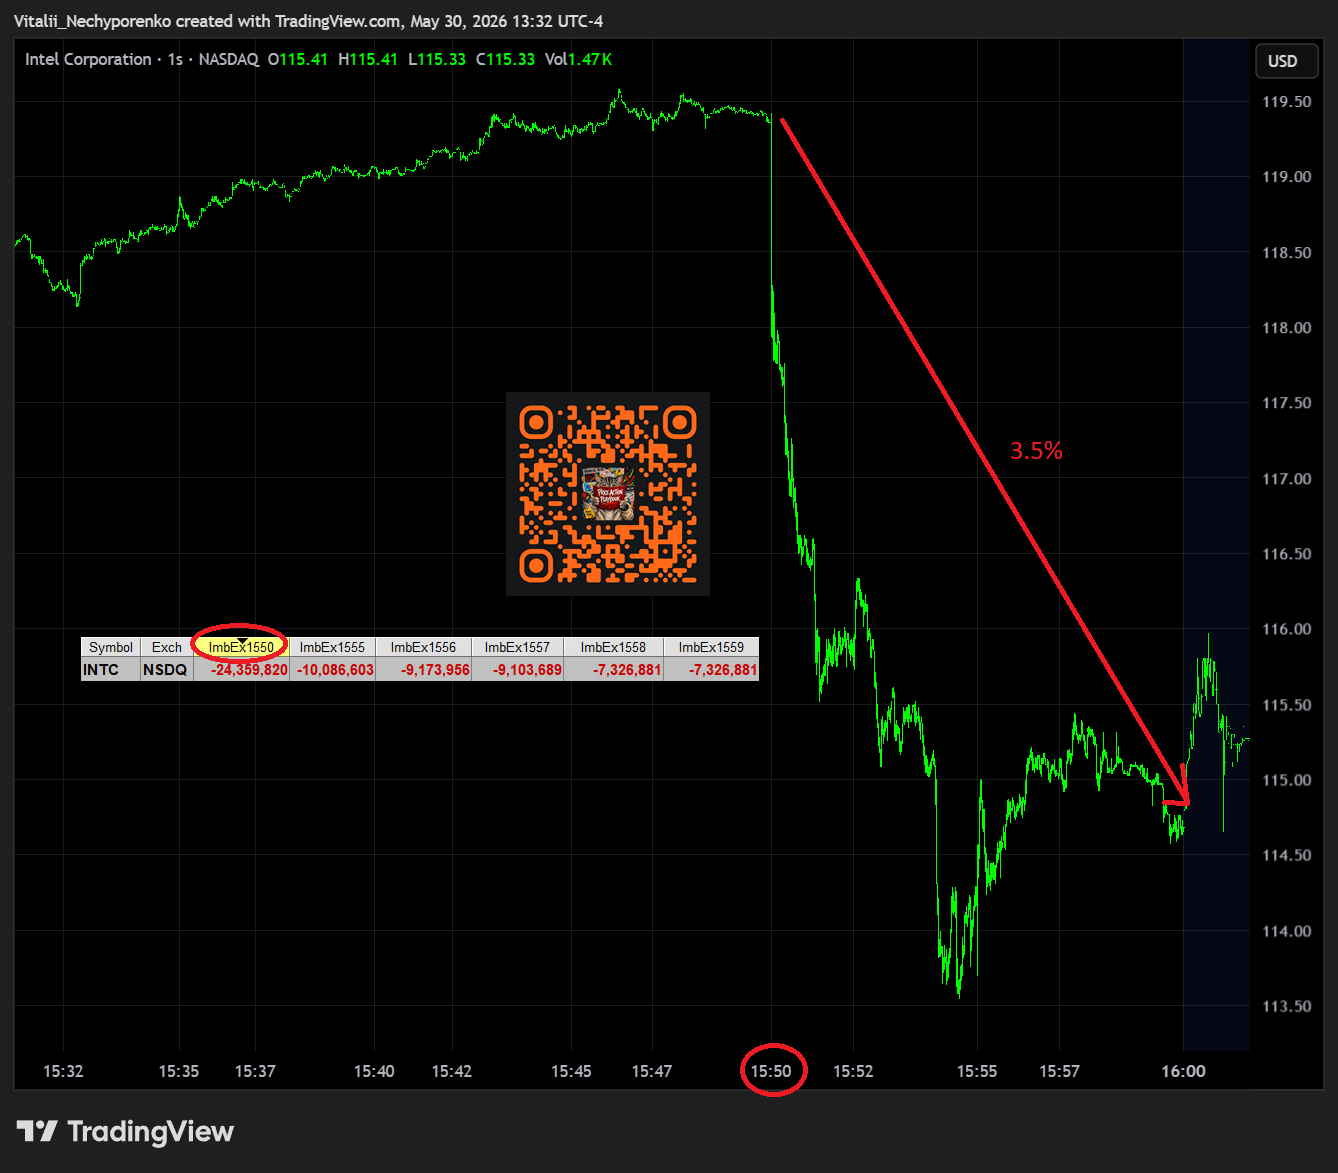
And now let’s take a look at what was actually sold in May. Intel posted a 24.3 million share sell imbalance, translating to roughly $2.9 bln in notional and a 3.5% move, which nearly reached 5% at the lows.
And what about the green cherry on top? Not so green after all.
Nvidia posted a 37 million share Nasdaq sell imbalance, roughly $8 bln in notional to sell, pushing the stock 2.5% lower in the final minutes of trading.
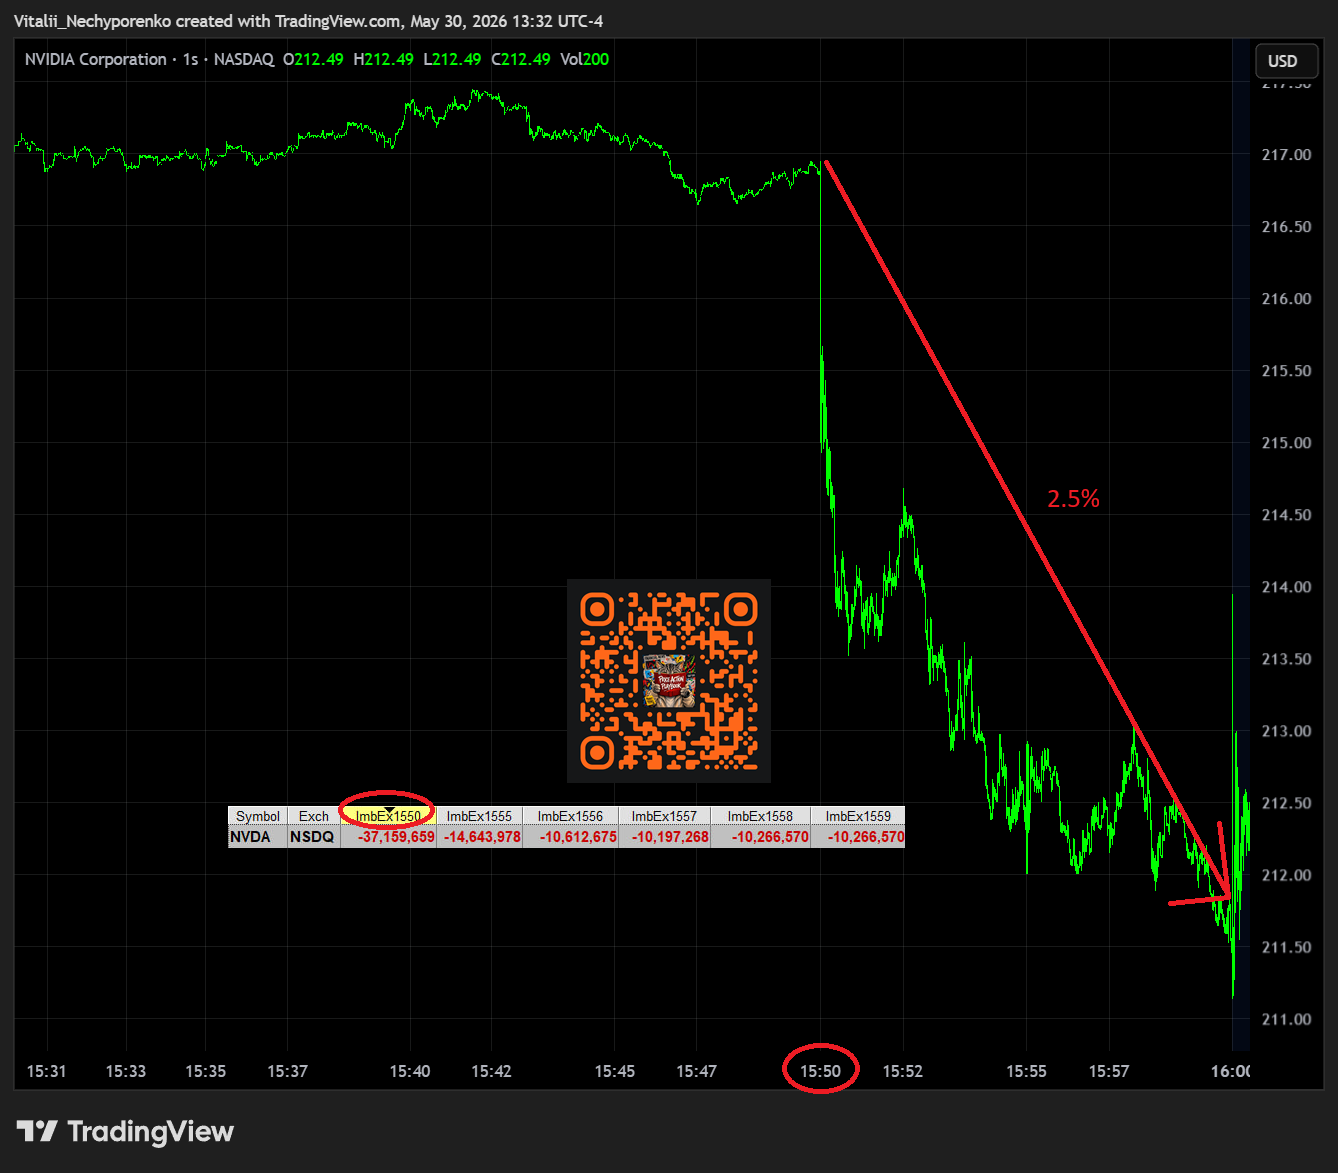
Turns out “Sell in May” worked after all. You just needed the right stock and about 10 minutes.
Meanwhile, FTSE Russell released its preliminary reconstitution portfolio on Friday after the close, kicking off the update cycle that will culminate during the final minutes of trading on June 26.
Just a reminder: starting this year, we will have two Russell reconstitutions instead of one. Add that to the four annual Quadruple Witchings and four annual MSCI rebalances, and the calendar is becoming increasingly crowded with events capable of moving serious money.
Not something active speculators should ignore.
2. Key Index Charts
In this section I highlight only the most important zones with brief comments. I use fully layered charts to identify them, but keep the charts here clean for clarity.
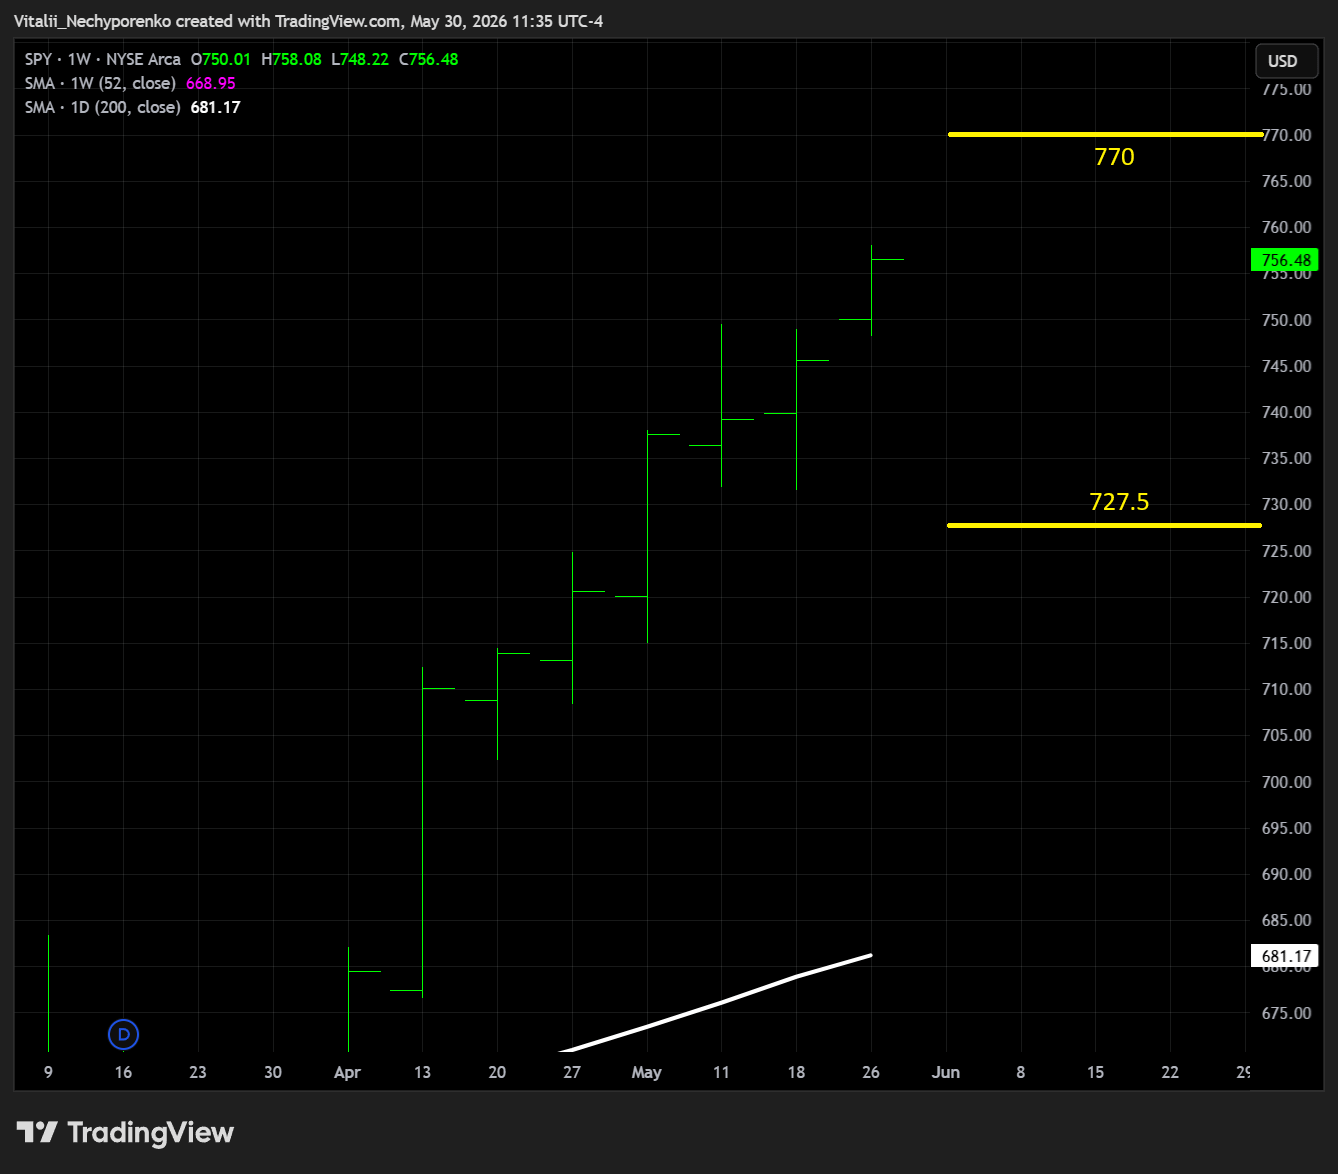
SPY
The S&P 500 ETF remains in higher-for-longer mode, with key resistance shifting slightly higher to 770 alongside the rising TRL angle, while key support remains intact at 727.5.
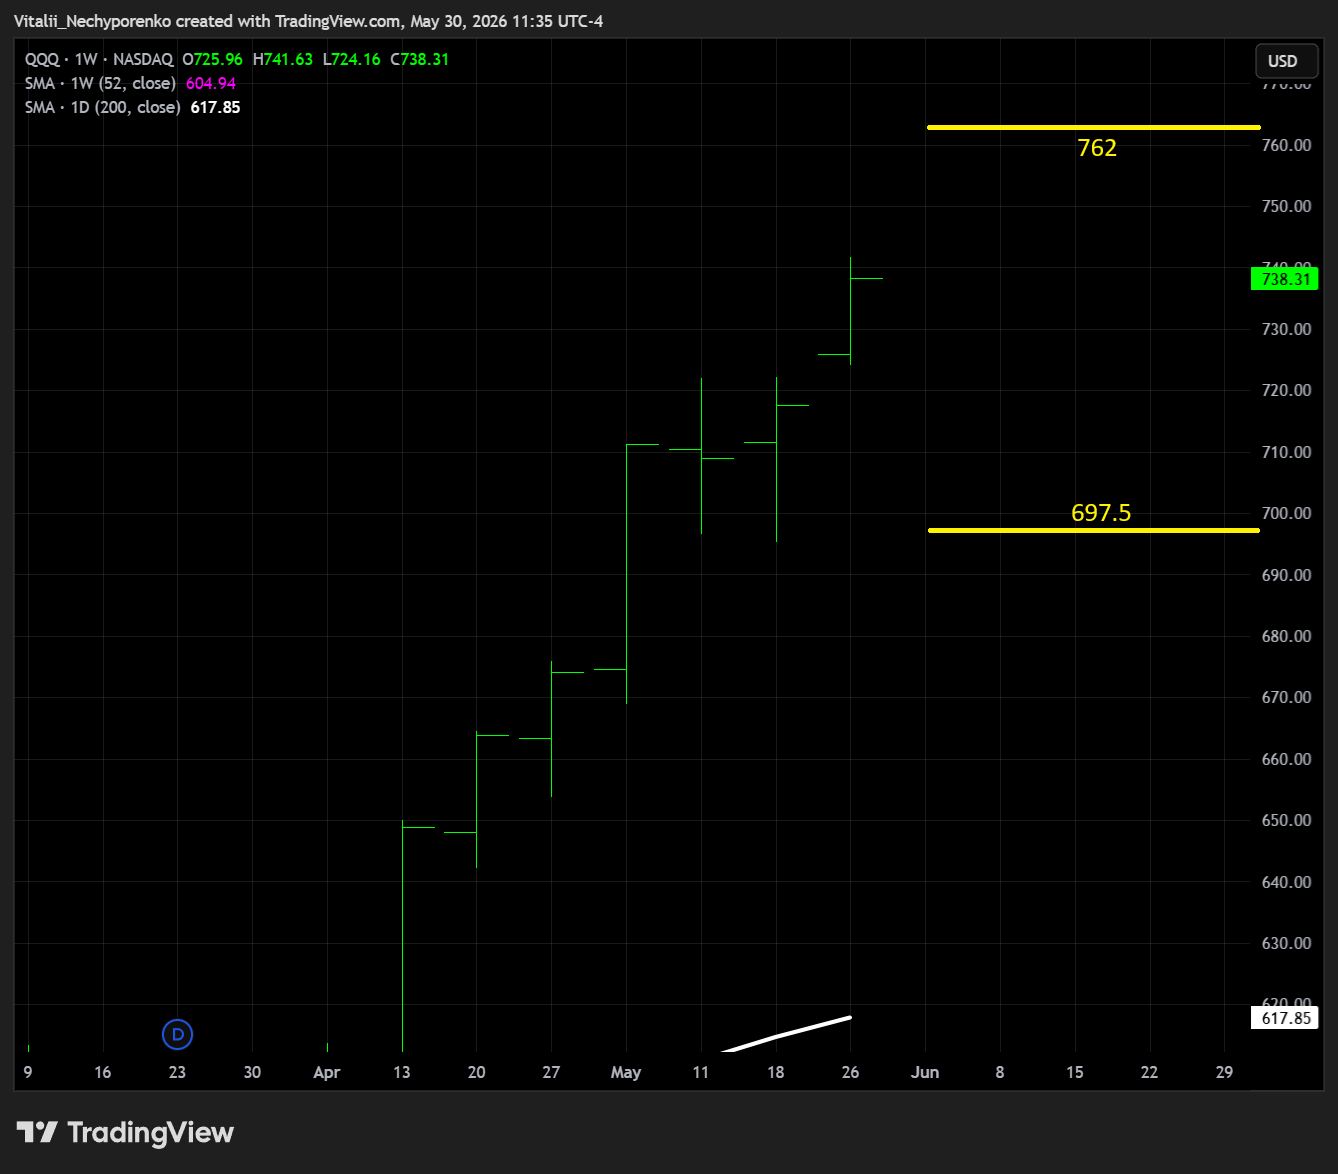
QQQ
The Nasdaq 100 ETF flipped another TRL highlighted last week. The next resistance to watch sits near 762, while key support also shifts slightly higher to 697.5.
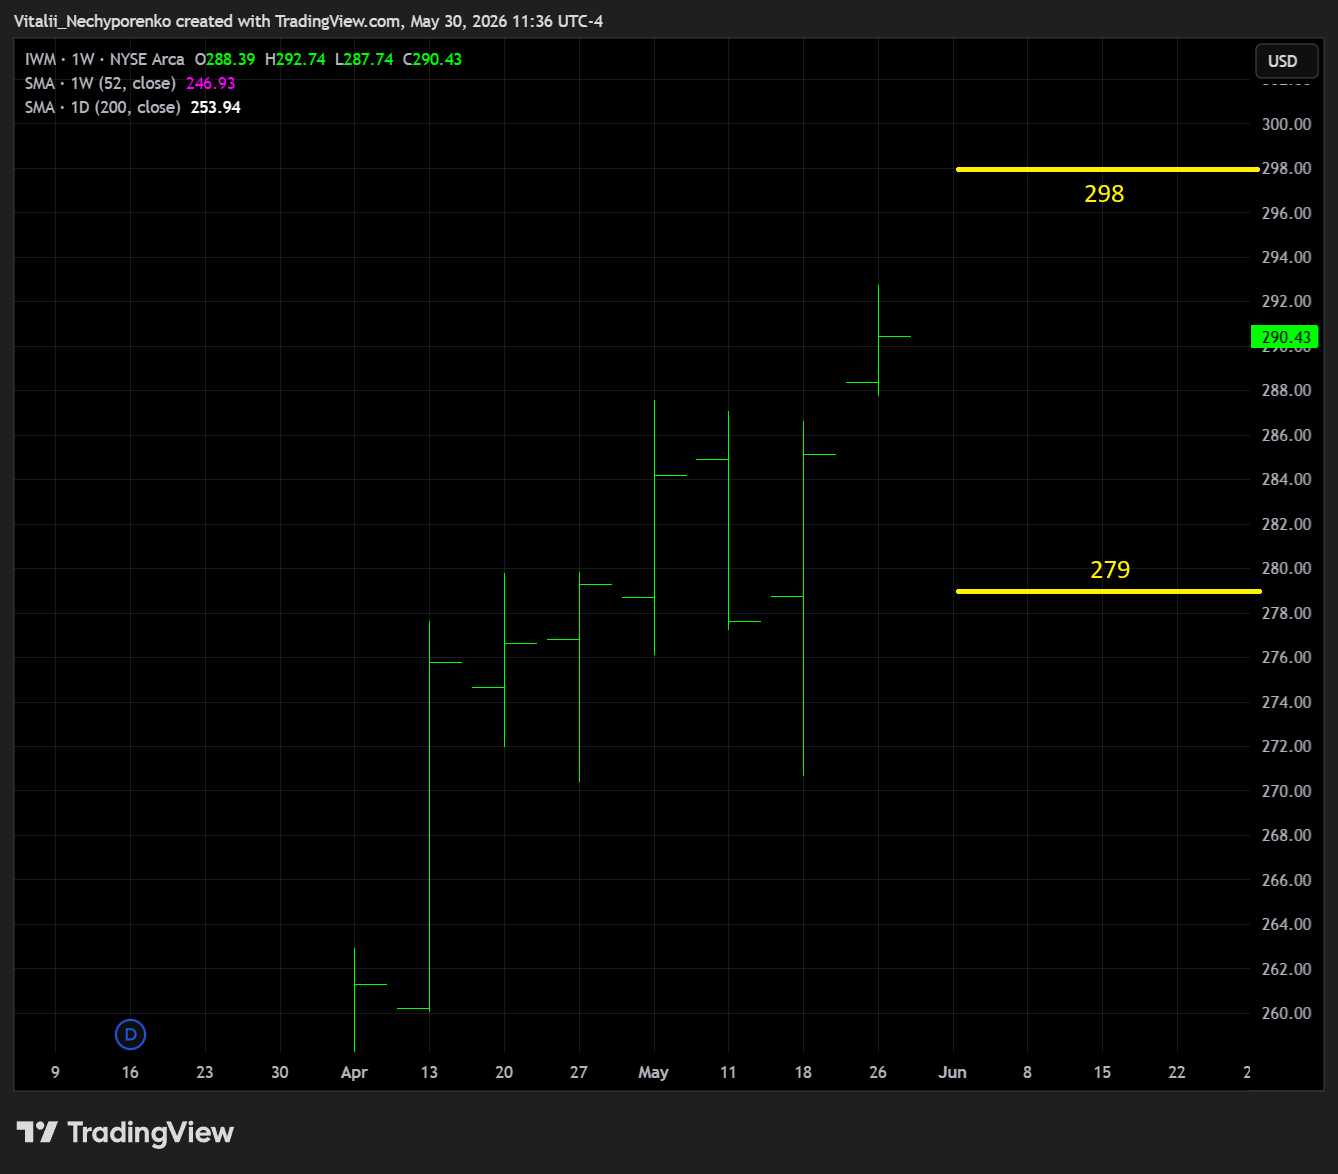
IWM
The Russell 2000 ETF sits somewhere in between, with key resistance shifting slightly higher to 298, while key support moves up to 279.
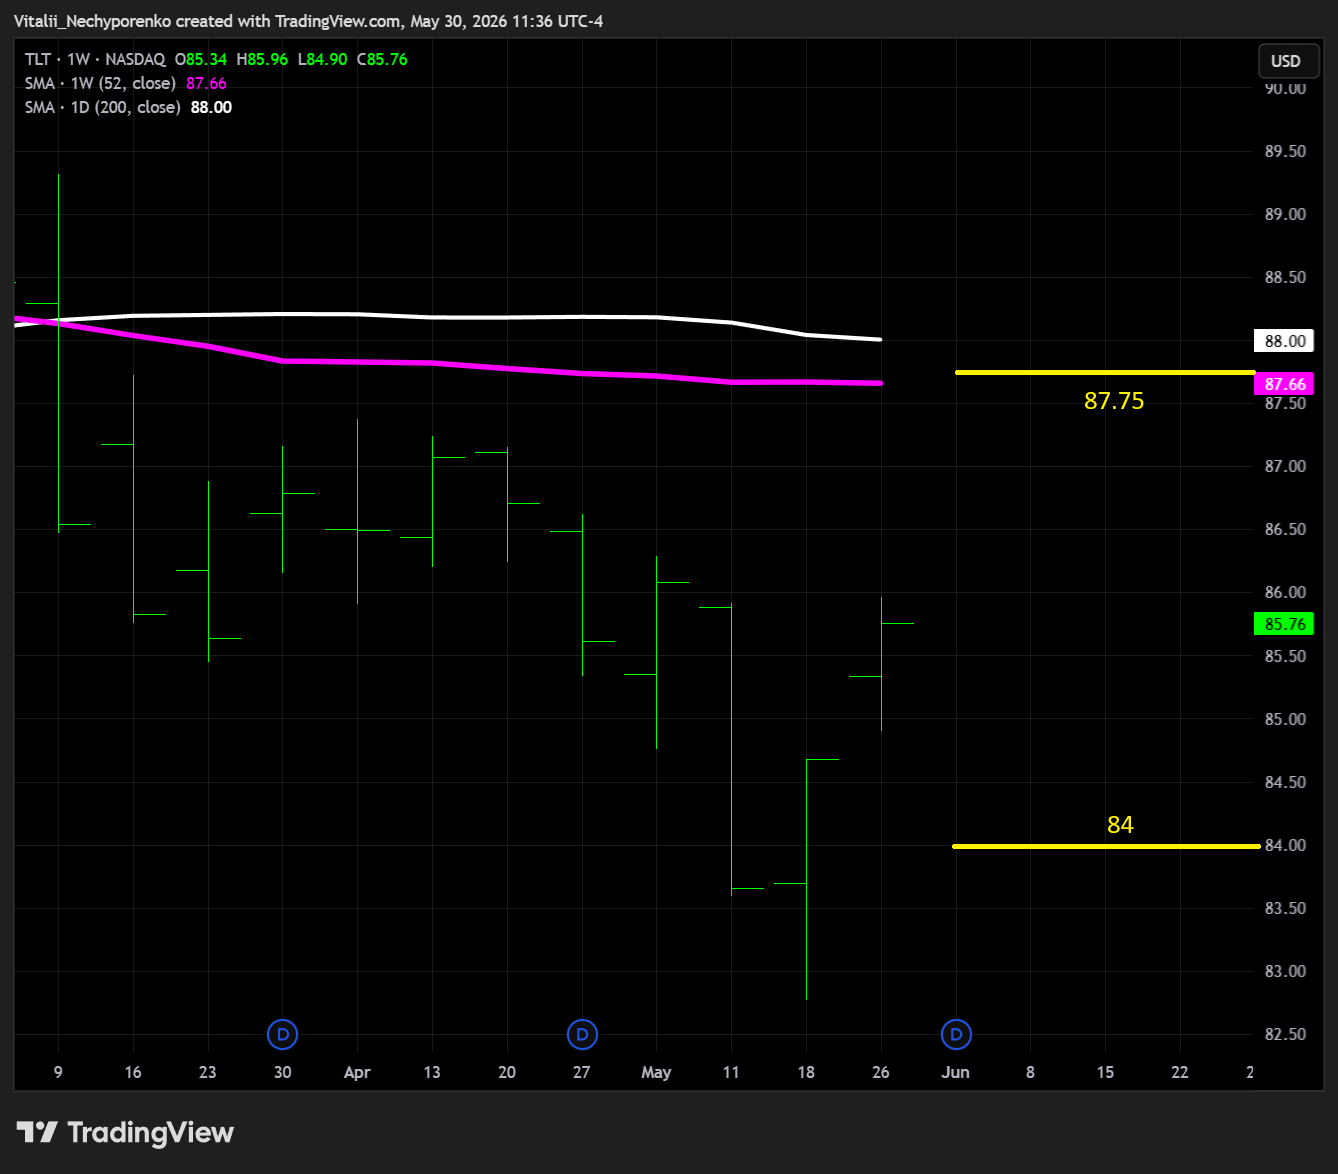
TLT
The 20+ Year Treasury Bond ETF has put some distance between itself and the previously mentioned weekly TRL after reclaiming it, suggesting higher rates might be off the table, at least while that area continues to hold. Key support moves to 84, while key resistance shifts higher to 87.75.
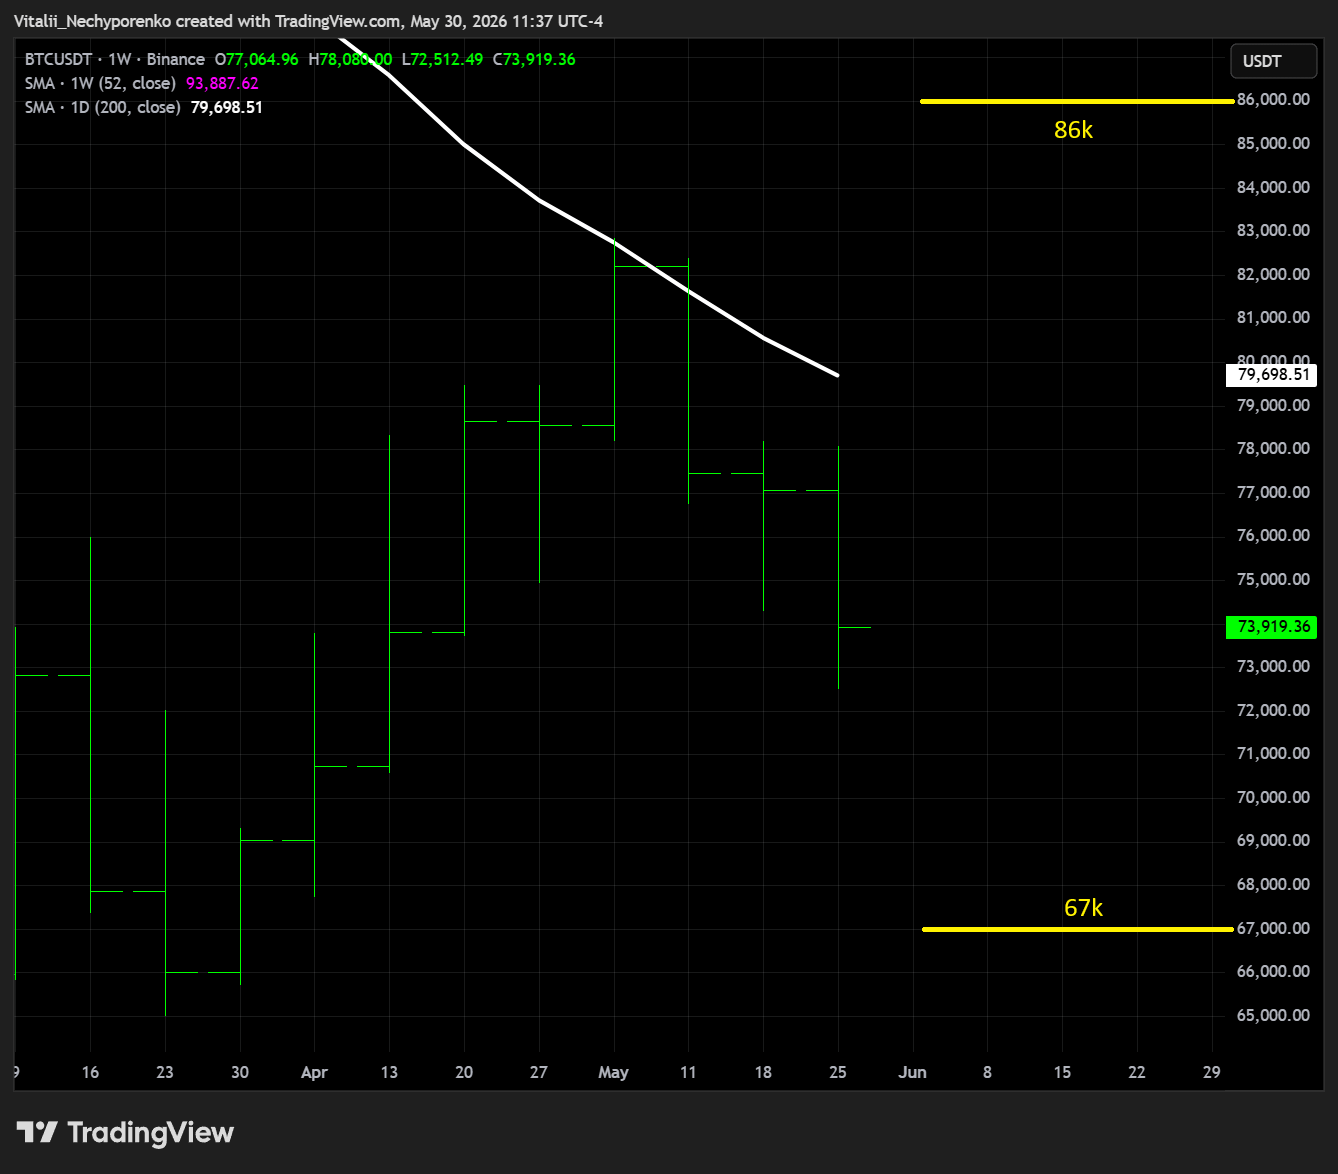
BTC
Bitcoin saw some volatility, but the bigger picture remains unchanged, trading well below the 200-day moving average, while key support and resistance areas remain intact at 67k and 86k, respectively.
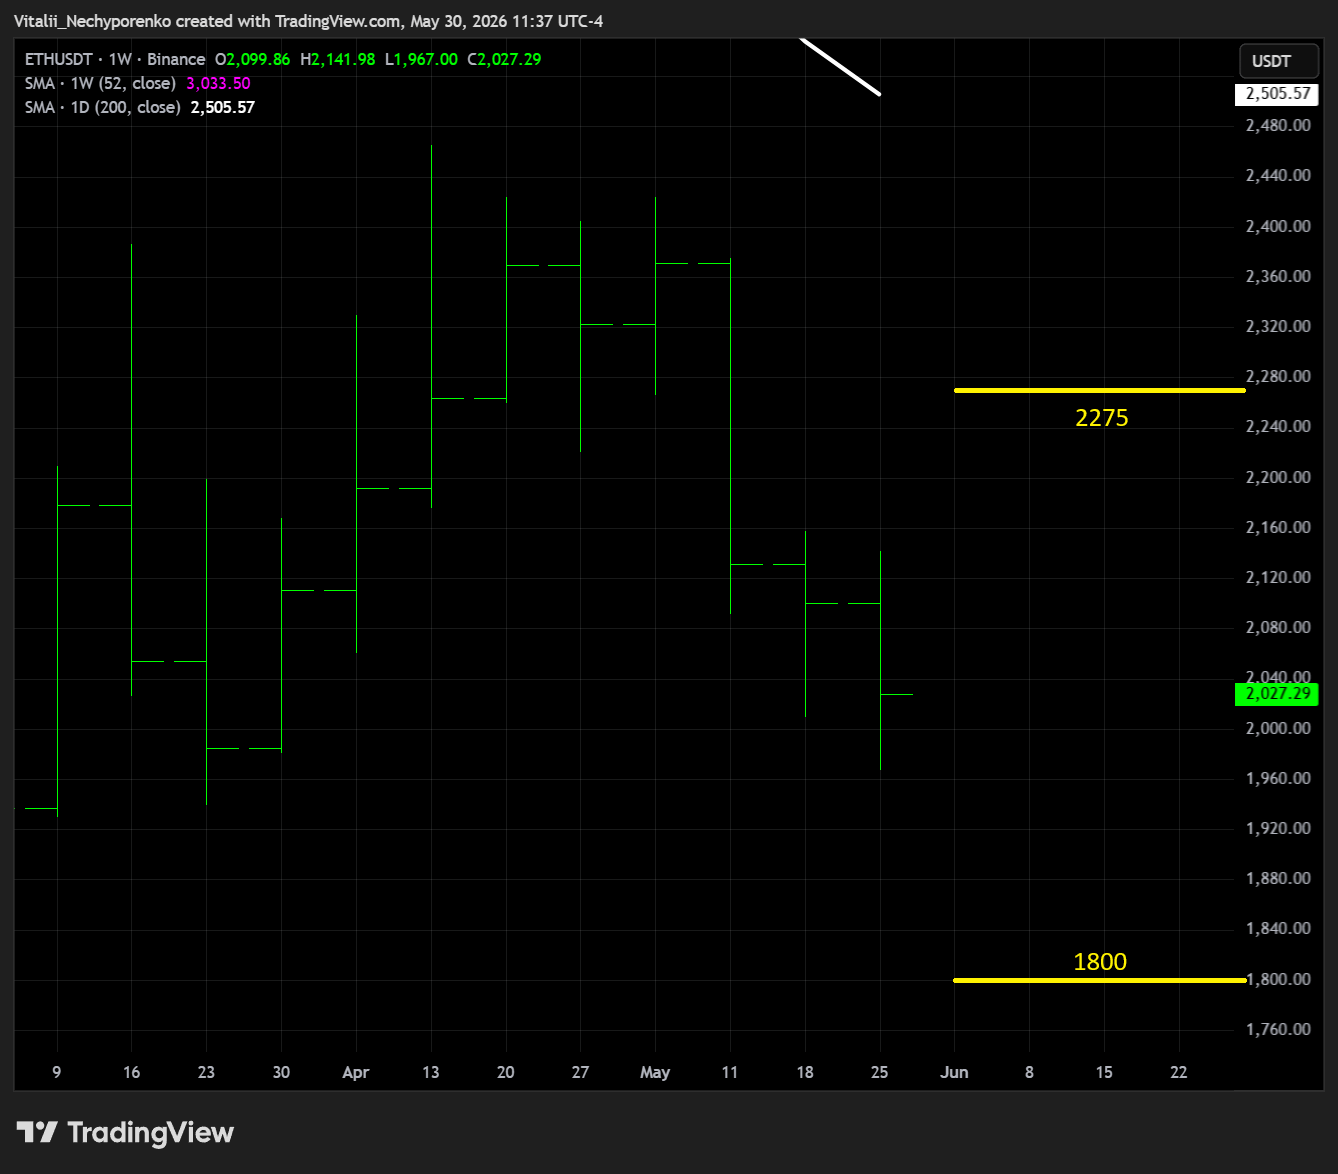
ETH
Ethereum looks similar, with key support and resistance areas remaining intact at 1800 and 2575, respectively. Meanwhile, the 200-day moving average continues its slow but steady approach toward Tom Lee’s 2400 target.
Maybe he meant the moving average all along. We just got it wrong.
3. Earnings & Interesting Movers Recap
Below are snapshots from the Price Action Playbook: Research dump for the week
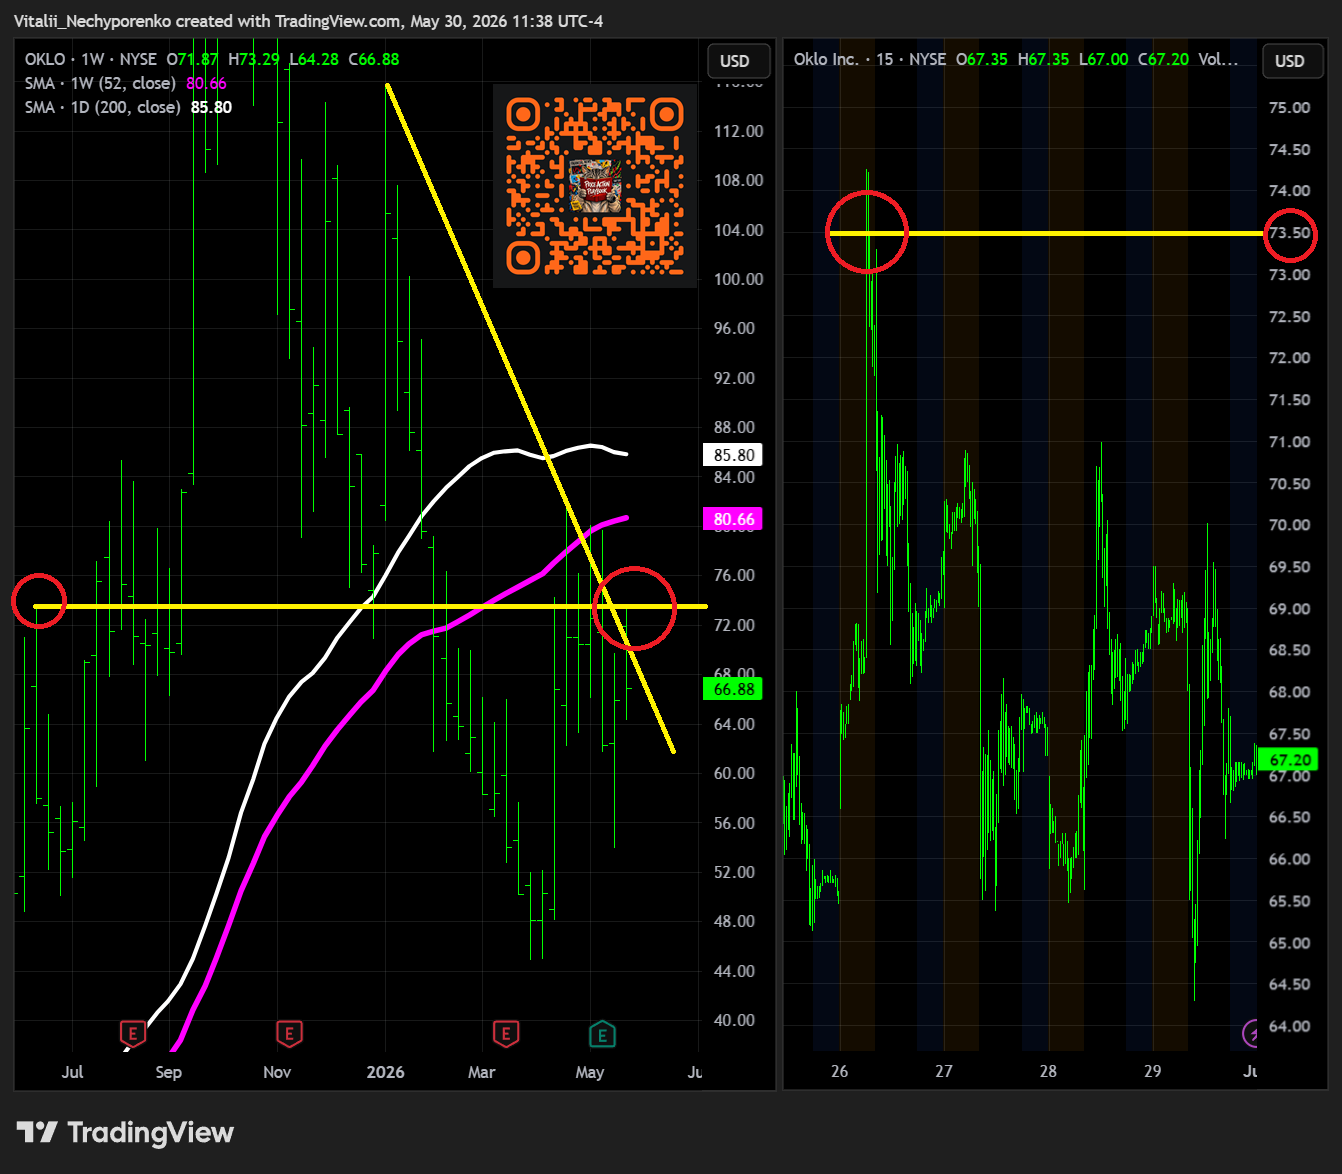
OKLO 73.5
Oklo was selected by the U.S. Department of Energy for advanced negotiations under the Surplus Plutonium Utilization Program, a potentially important step in securing long term fuel supply for its advanced reactor ambitions. The program is designed to make designated surplus plutonium available for conversion into reactor fuel, providing another pathway for advanced nuclear developers as domestic enrichment and fuel infrastructure continue to expand. Oklo's proposal includes a partnership with European reactor developer newcleo, which would contribute fuel expertise and potential project capital, while Oklo would lead the utilization effort subject to definitive agreements, regulatory approvals, and U.S. security requirements. The announcement further strengthens the company's broader fuel strategy and highlights growing government support for next generation nuclear technologies as demand for reliable baseload power continues to rise.
73.5 marked the prior weekly pivot high, with a developing POC sitting just one point above. Overall, the pattern looked like a make-or-break moment as price attempted to clear a fresh but highly reactive weekly DTL.
And we got the answer.
ZS 144
Zscaler delivered another strong quarter, beating expectations on both revenue and earnings while continuing to demonstrate healthy demand for its Zero Trust platform. Annual recurring revenue grew 25% to $3.525 bln, deferred revenue increased 25% to $2.477 bln, and non-GAAP operating margin reached a record 23%. AI-driven demand remained a key growth driver, with AI Protect bookings surpassing $100 mln over the past 12 months, customers generating more than $1 mln in ARR rising 18% to 748, and Z-Flex multi-year commitments exceeding $1 bln in total contract value. Management also raised FY26 guidance for ARR, revenue, and EPS. However, investors focused on a sharp reduction in free cash flow expectations as rising hardware costs accelerated equipment purchases and pushed CapEx requirements higher. The departure of two senior sales leaders during the quarter and management’s cautious FY27 outlook projecting ARR and revenue growth of 16-17% also raised concerns about future growth momentum, highlighting the balance between strong current execution and a potentially slower growth profile ahead.
Let's take a look at this perfect example of a layered area at 144: