
Weekly Playbook: December 8th
So I know that when it’s time to start Thinkorswim, That J Powell is here in me, right underneath my skin


It’s like I’m paranoid, lookin’ over my back
It’s like a whirlwind inside of the Fed
It’s like I can’t stop waitin’, hearin’ from him
It’s like the chairman himself is right beneath my skin
Key Takeaways This Week
A December cut is priced at 86.2% and the balance sheet remains the real driver that could shift liquidity from drag to fuel
Long yields not cooperating show policy is still far from risk free
S&P 500 sits near highs with dip buyers in full control
Last week’s movers: TLT, MDB, MRVL, CRM, DG, META and NFLX
Earnings to watch this week: ADBE, ORCL, SNPS, CIEN, AVGO, COST and LULU
Table of Contents
Market Overview
Playbook Podcast Spotlight
Key Index Charts
Earnings & Interesting Movers Recap
Earnings to Watch This Week
1. Market Overview
The market spent the week marching toward a December cut that is already locked into expectations, with futures pricing an 86.2% chance of a 25 basis point move to a 3.5%-3.75% target range. Stocks pushed right up to record highs, with the S&P 500 finishing the week up 0.3% and the Nasdaq gaining 0.9% as traders decided restrictive policy does not feel very restrictive when asset prices climb and volatility refuses to stick.
Under the surface, the split nature of this economy keeps widening. Payrolls showed a net loss of 32k private sector jobs while jobless claims fell to a three year low. That combination is exactly how a K shaped backdrop behaves: lower income households are bumping against credit limits while upper income spending keeps the economy afloat. Credit card data confirms the divide. Markets are leaning heavily on the wealth effect created by a 73% three year advance in the S&P 500, even if the bottom rung continues to feel squeezed.
This is why the interest rate move is only half the story. The Fed halted balance sheet runoff on December 1 after shrinking roughly $2.5 trillion from the $9 trillion pandemic peak. Analysts expect Treasury bill purchases to resume in early 2026 in a range of $15 billion to $45 billion a month. That shift would quietly turn liquidity from a headwind back into a tailwind. Investors remember what it looks like when the firehose turns on, and risk assets are already trading as if the pivot is in play.
Seasonality is helping too. December has historically delivered a 1.4% average gain in its final two weeks and traders know that pattern well. Dip buyers responded quickly whenever weakness surfaced and the tape still looks more afraid of missing upside than of macro cracks forming underneath. As long as pullbacks remain shallow and breadth does not collapse, seasonal momentum stays in control.
Breadth actually improved. Retail names caught a bid thanks to solid holiday spending trends. AI linked stocks regained footing as risk appetite returned. Inflation readings came in as expected and reinforced the confidence narrative. Credit spreads remain near historic lows, signaling little concern about stress even as AI build outs, industrial policy, and federal deficits pull more capital into the system.
Corporate headlines added some leverage flavored drama. Netflix is paying about $83 billion including debt to acquire Warner Bros film and TV assets along with HBO, valuing the business at roughly 25 times estimated 2026 EBITDA and lifting Netflix’s pro forma debt load from $16 billion to around $76 billion. Synergies may eventually help, but execution risk is no longer theoretical and equity holders noticed.
Meanwhile, fresh predictions for 2026 are already flooding inboxes with confident soft landing narratives. Affordability data tells a different story. Consumer prices are up more than 26% since 2020 while wages have risen only about 22%. Groceries matter more than CPI methodology. Whoever solves the inflation of daily life wins the political cycle and whoever does not will keep hearing about it.
All of this leaves the Fed in an uncomfortable position. Short rates may fall again, yet the 10 year yield climbed to 4.14% this week, hinting that mortgages, business loans, and Treasury financing costs do not necessarily follow the front end of the curve. Liquidity needs are growing faster than nominal GDP and foreign buyers, particularly in Japan where yields have surged, are no longer guaranteed reinforcements.
For now the market continues to look up. The path toward new highs is open. Momentum favors the bulls into year end and traders want the Fed to validate the optimism. But liquidity runs the show more than policy rates and the difference between a smooth glide into 2026 and a January air pocket may come down to a few sentences in the press conference.
Respect the tape, respect your risk, and keep one eye on the balance sheet language. If the Fed confirms that liquidity growth is coming, the rally has fuel. If not, the hangover could arrive faster than anyone wants.
2. Playbook Podcast Spotlight
3. Key Index Charts
In this section I highlight only the most important zones with brief comments. I use fully layered charts to identify them, but keep the charts here clean for clarity.
Markets continued to march higher, which is not surprising given the recent volatility reset, even if bonds and crypto did not get invited to the marching band this time. Maybe next week they will earn a seat. Now let’s go to the charts:
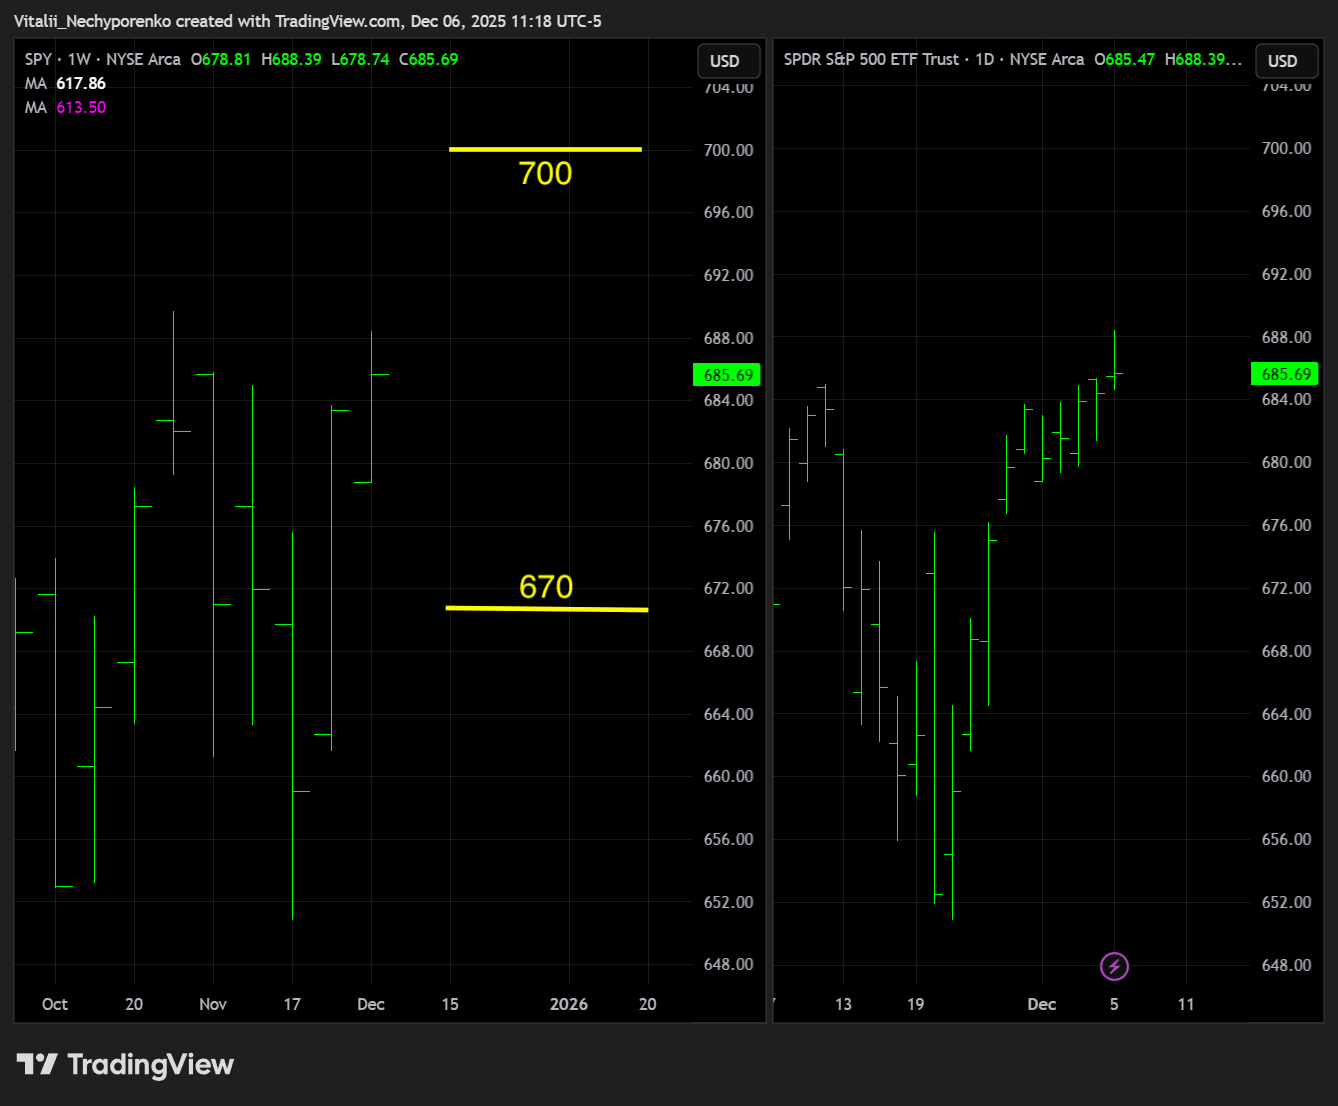
SPY
The S&P 500 ETF did not quite reach the mentioned point of reference at 693, but it finished the week within less than 1 ATR of the all time high. A reaction to that zone should be seen sooner rather than later, with key resistance now shifting toward 700 in line with the weekly TRL angle, while key support edges up toward the 670 area.
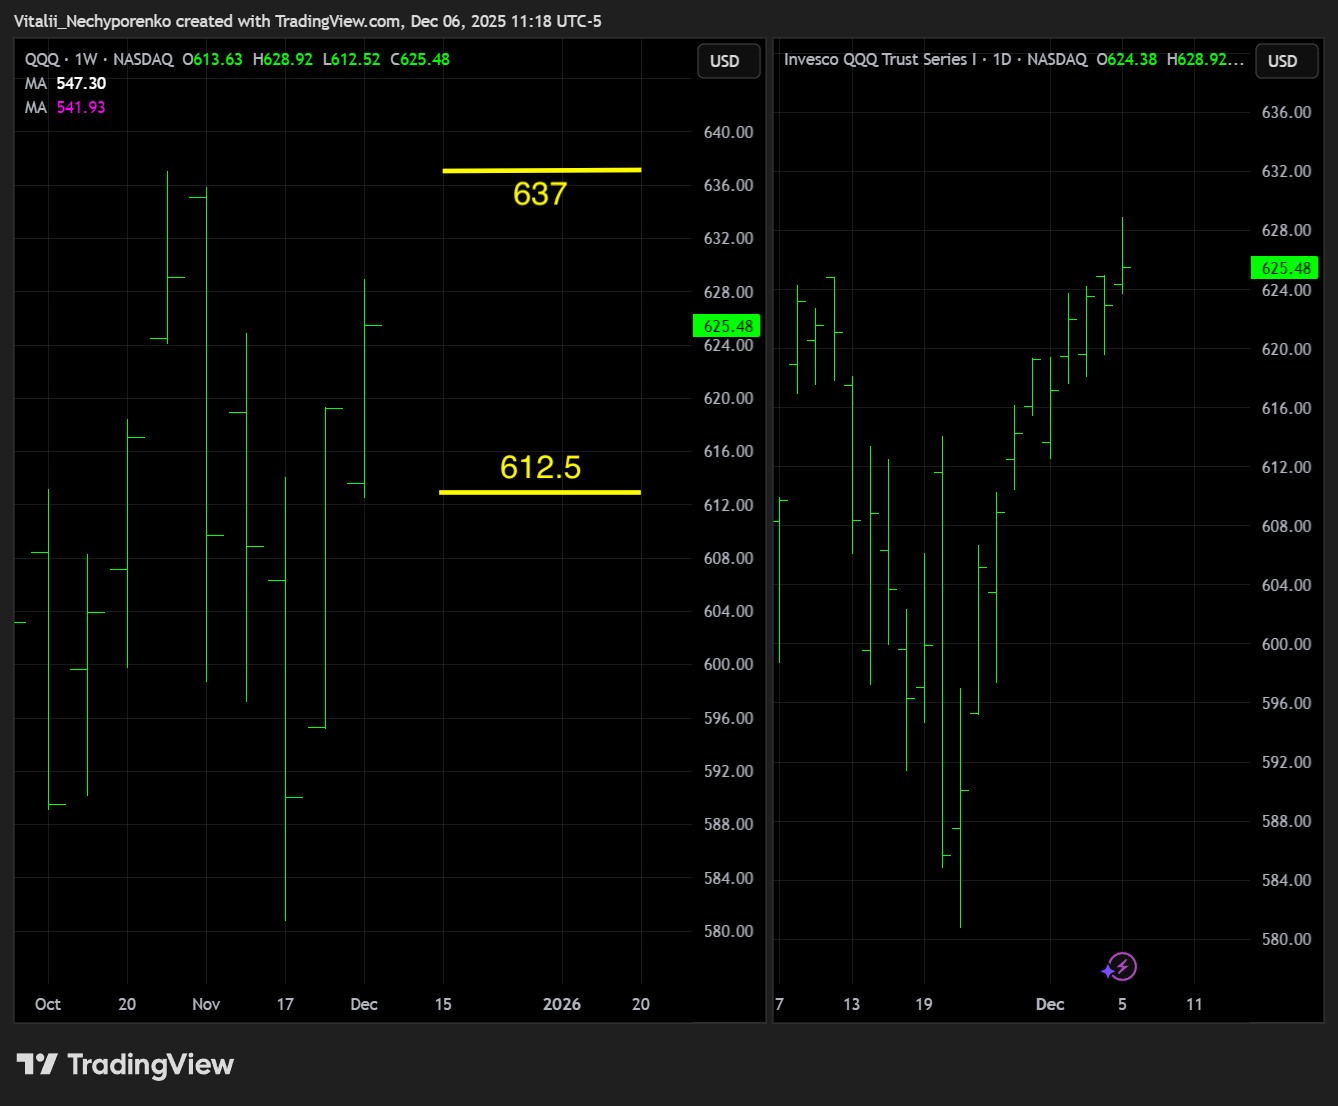
QQQ
The Nasdaq 100 ETF showed some respect to the mentioned 627.50 level, though for now it remains more of a reference point than a decisive level. Key resistance to watch is still 637 at the all time high, while key support shifts higher to 612.5, matching this week’s pivot low.
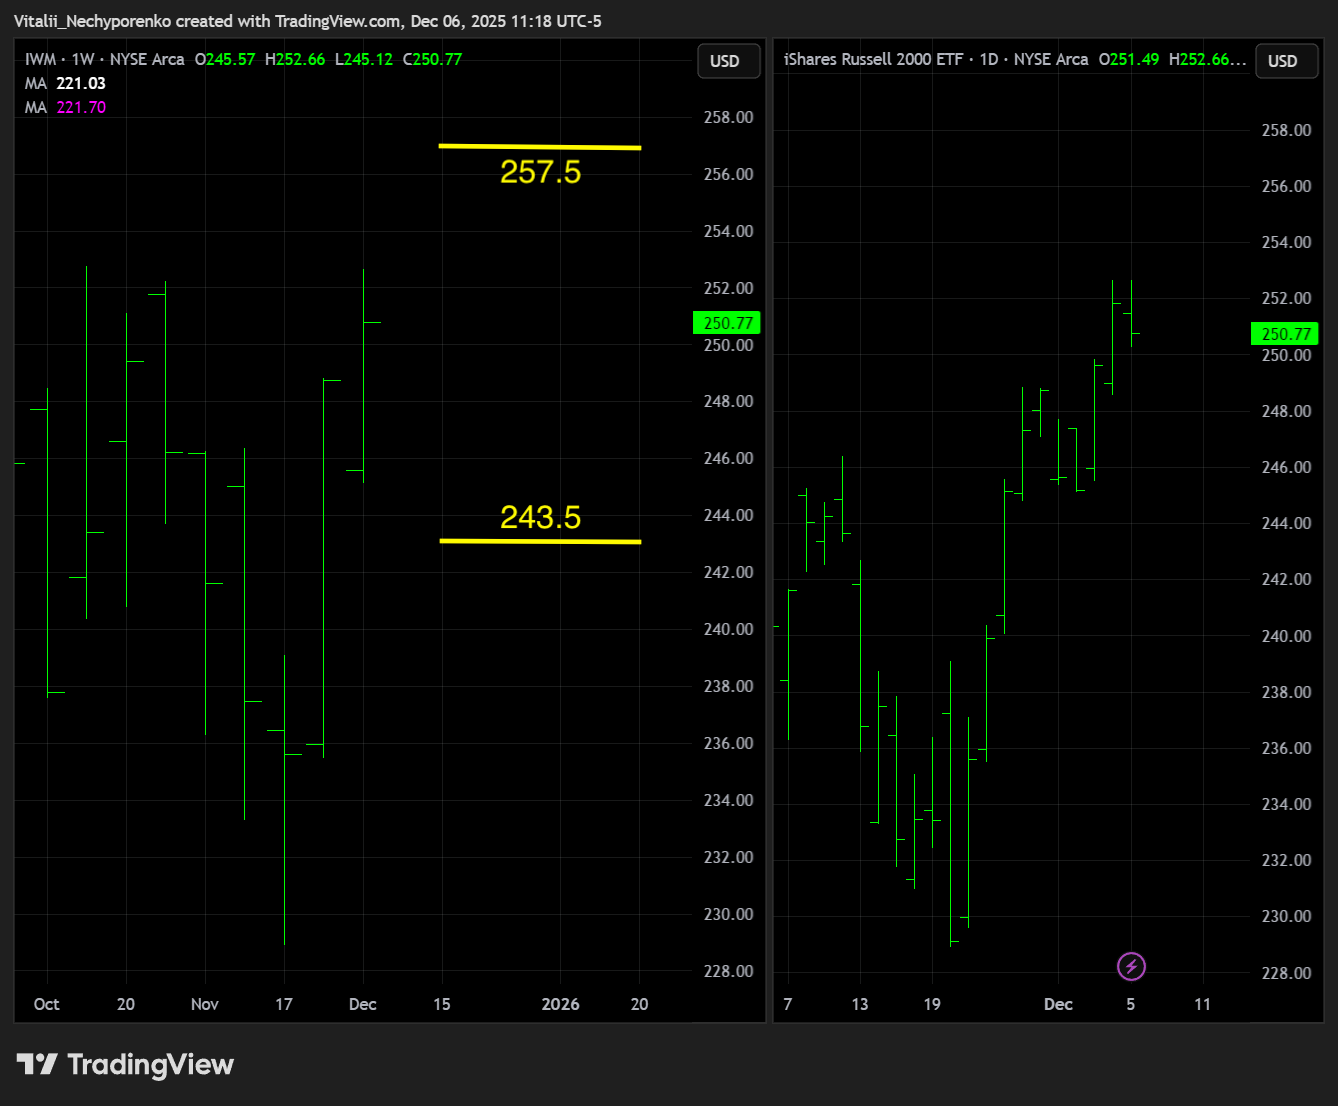
IWM
The Russell 2000 ETF did not clear the all time high but came as close as possible before a slight pullback on Friday. The next test of that level should tell us more, with key resistance shifting to 257.5 in line with the weekly TRL angle, while key support moves up to 243.5.
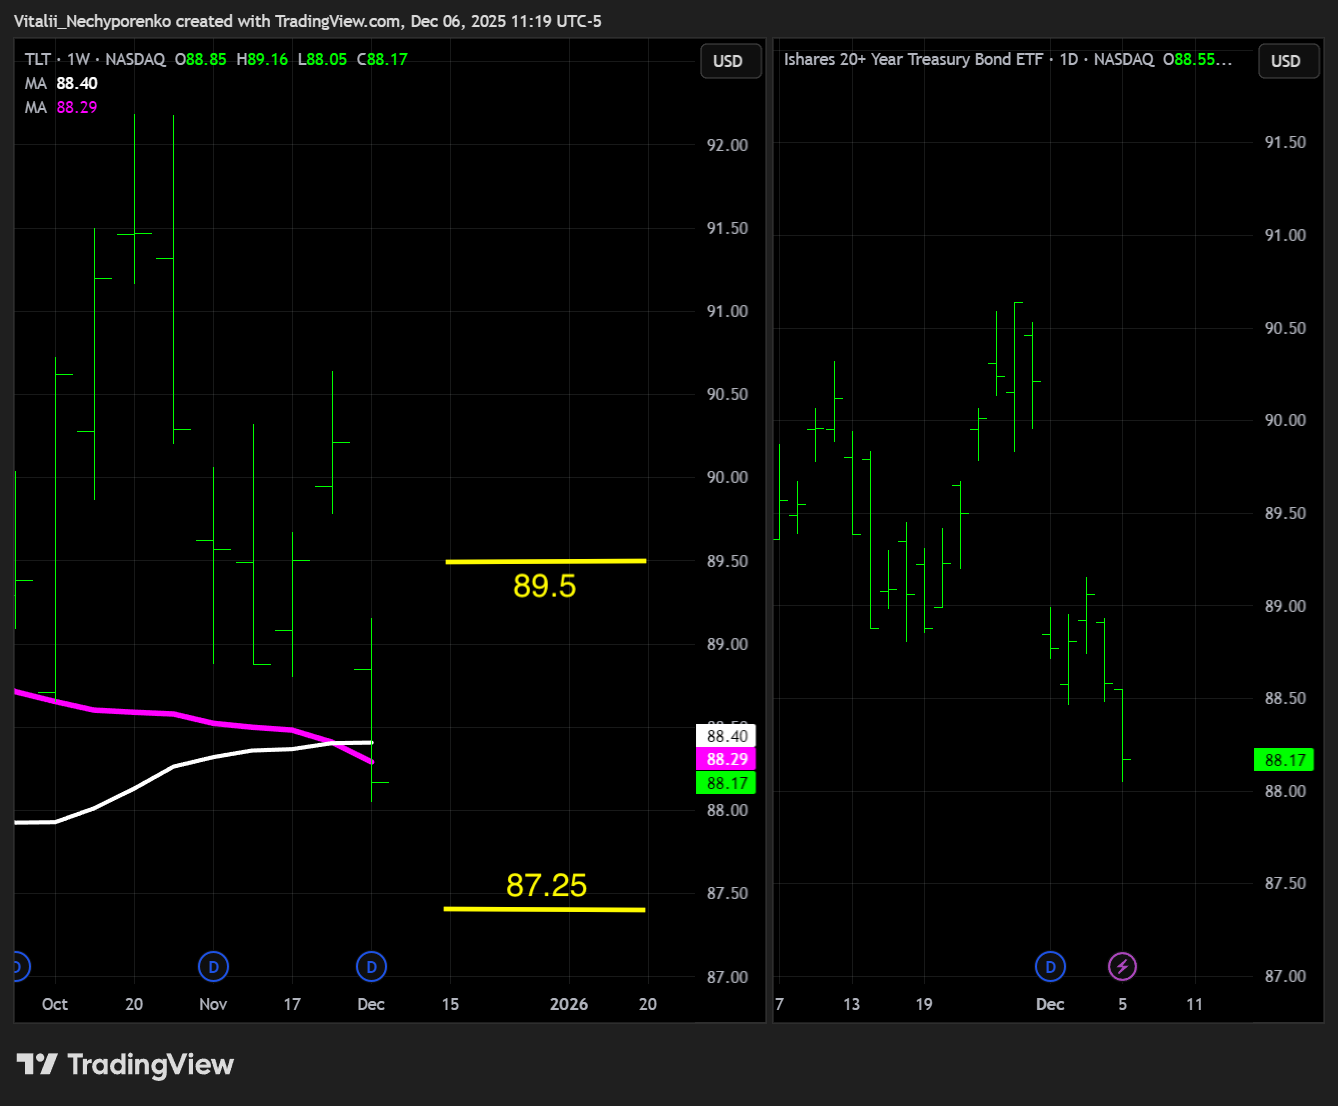
TLT
The 20+ Year Treasury Bond ETF had a rough week ahead of the upcoming FOMC. The technical setup is highlighted in detail in the recap section, so for now the focus is on whether Powell and company make things worse or help it turn around. Key support shifts to 87.25, while key resistance moves to 89.50, the area where the breakdown occurred.
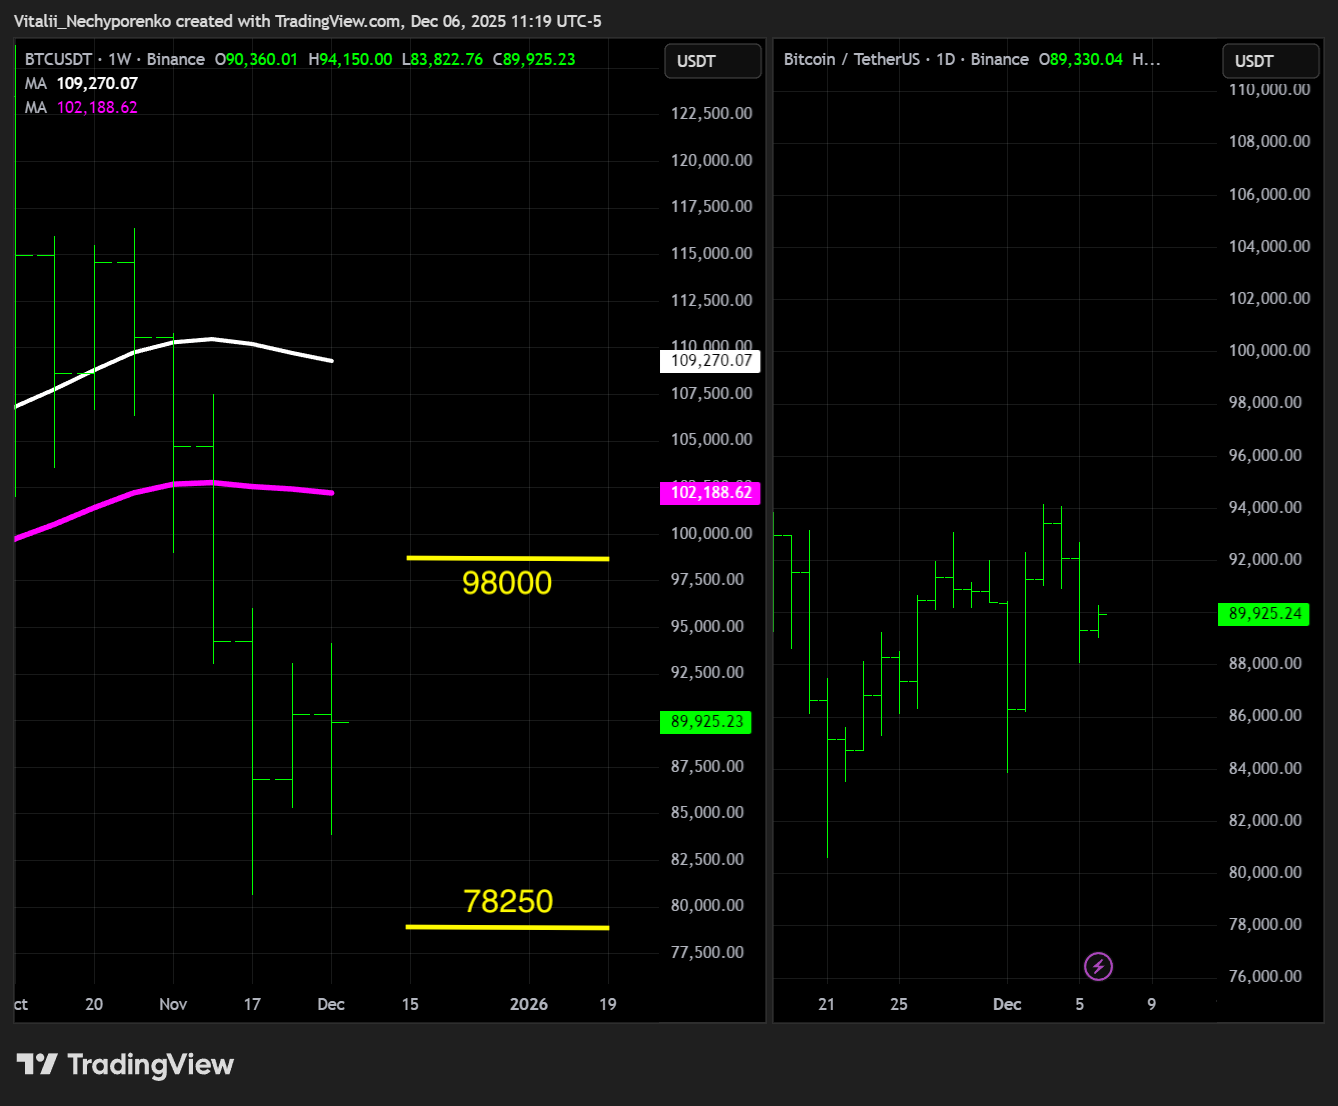
BTC
Bitcoin’s “grounce” looks short lived, though while anything can happen it same applies in both directions😁 Key support shifts slightly lower to 78250, while key resistance moves to 98k.
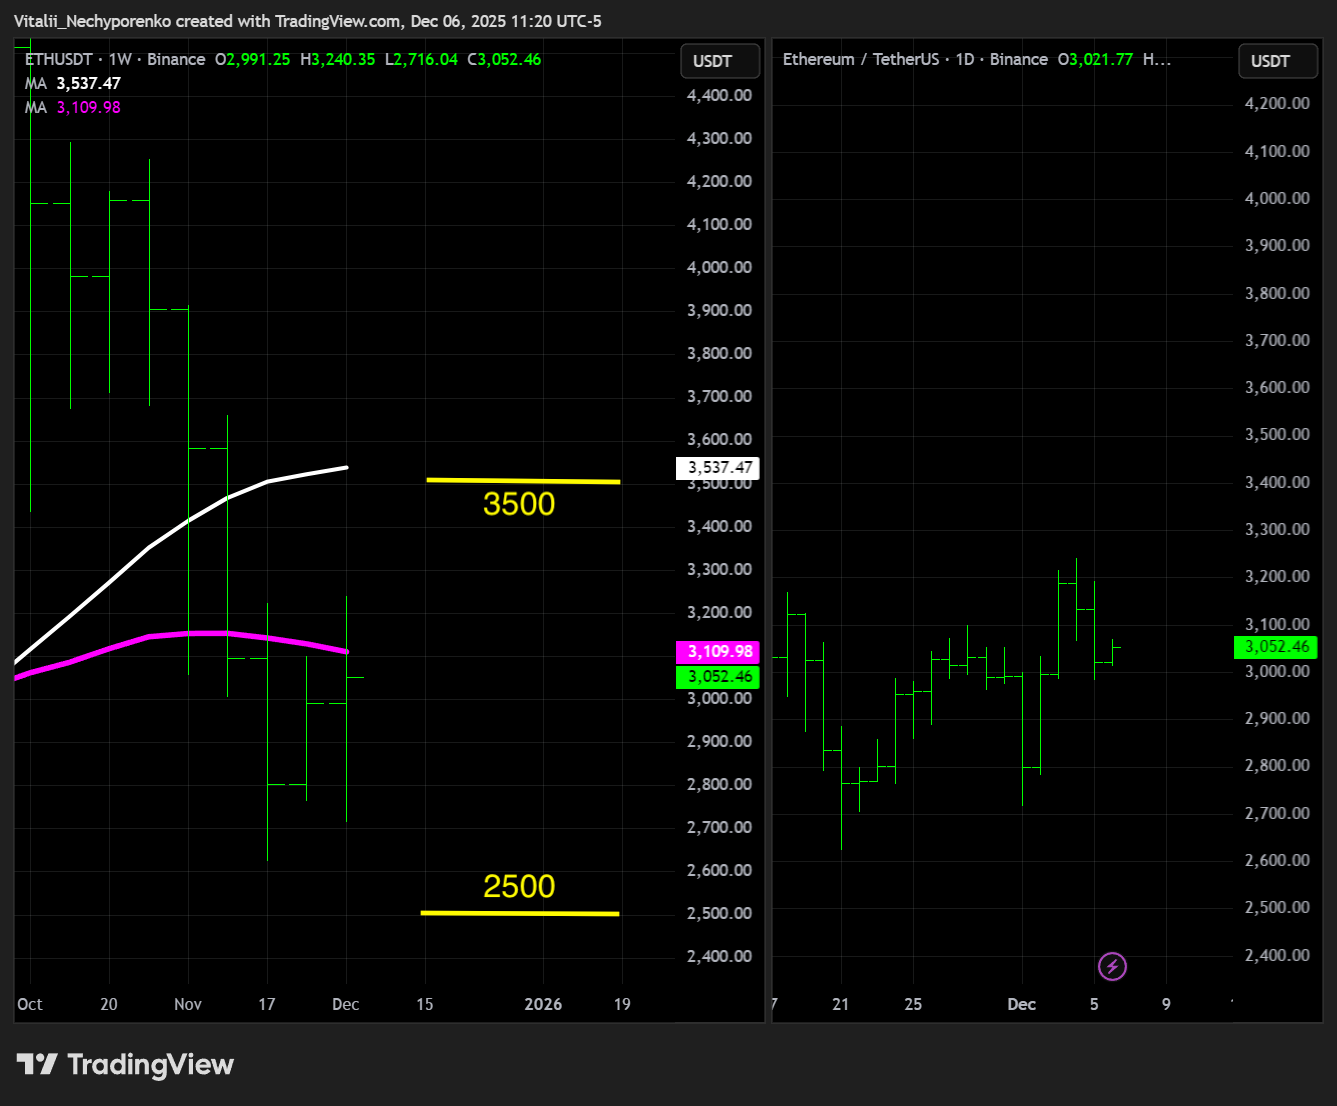
ETH
The Digital Collateral looks similar, with both key support and resistance levels remain intact at 2500 and 3500 respectively.
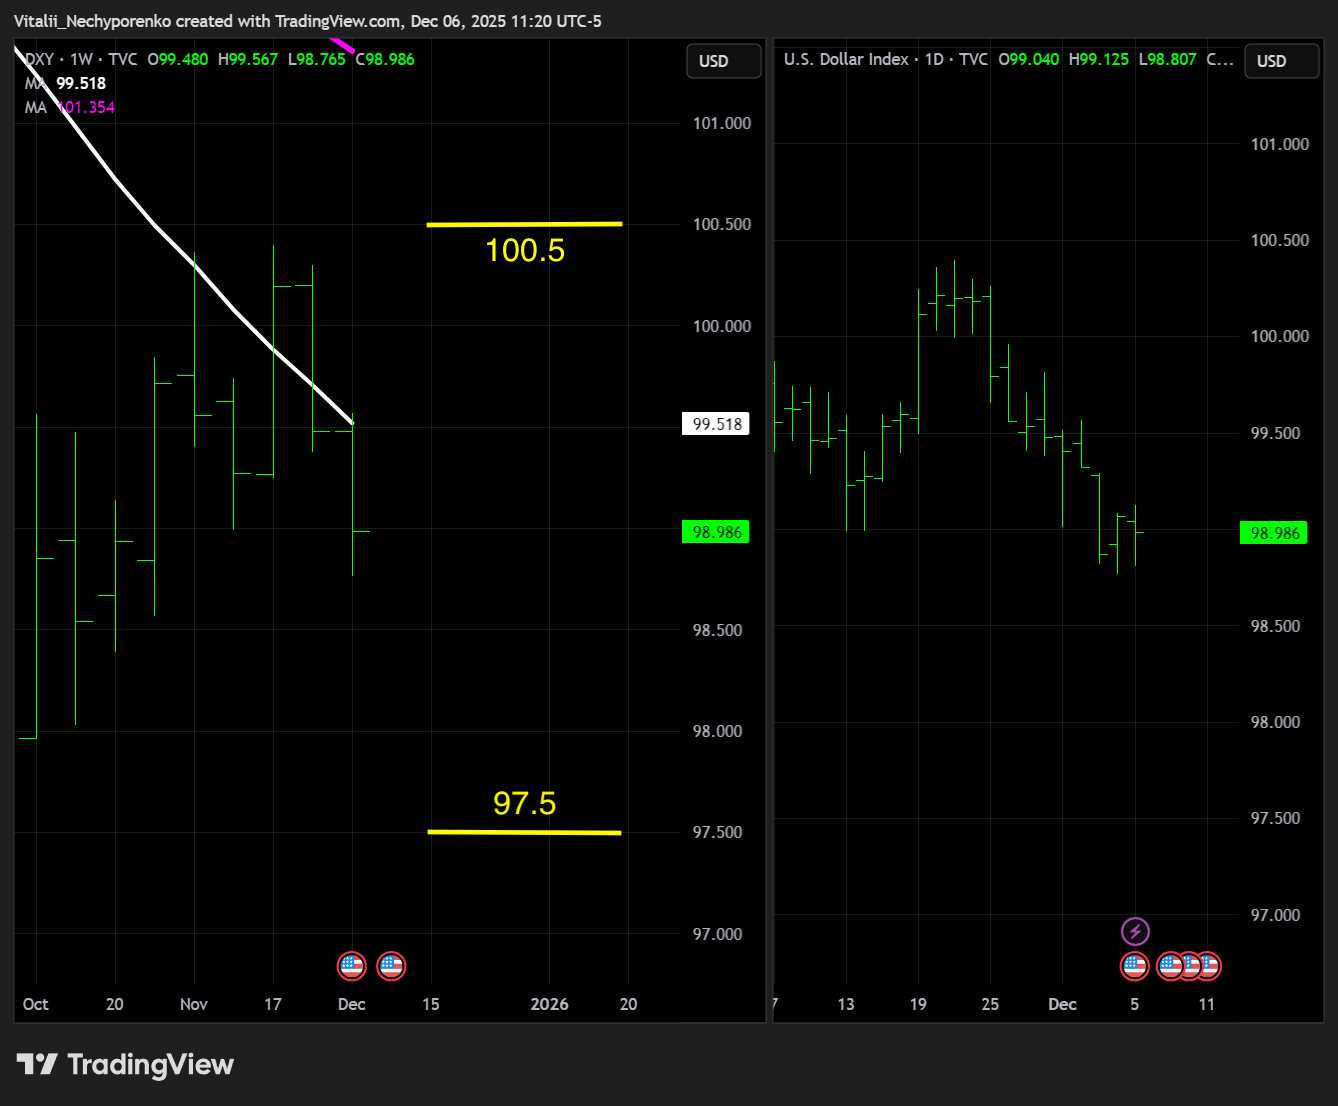
DXY
The dollar continued its slide, breaking below the BSL mentioned last week. Key support remains at 97.5, while key resistance shifts slightly lower to match the most recent pivot high at 100.5.
4. Earnings & Interesting Movers Recap
Keep reading with a 7-day free trial
Subscribe to Price Action Playbook to keep reading this post and get 7 days of free access to the full post archives.