


Key Takeaways This Week
Holiday shortened conditions muted participation, leaving price to drift on low engagement rather than fresh conviction
Gold pushing to new highs reflects persistent inflation and geopolitical risk beneath an otherwise calm tape
With no earnings and thin liquidity ahead, the path of least resistance is patience before earnings season resets the puzzle
Merry Christmas and Happy New Year!
Table of Contents
Market Overview
Playbook Podcast Spotlight
Key Index Charts
Earnings & Interesting Movers Recap
1. Market Overview
The final stretch of the year unfolded more as a slowdown in engagement than a shift in direction. The holiday shortened week compressed liquidity and attention at the same time, and for most participants not compelled to finalize exposure, the tape took a back seat to the calendar. Trading activity faded quickly, leaving price to drift rather than resolve, a familiar year end pattern when positioning is largely set and incentives to act are limited.
Equities leaned higher, but only modestly and unevenly. Large cap benchmarks added roughly 1% on the week, while smaller capitalization exposure barely moved. That divergence mattered. It pointed to continuation driven by where passive and benchmark linked flows naturally concentrate, rather than a renewed appetite for risk across the market. This was not a broad based chase. It was incremental upside carried by the same narrow areas that have dominated for months.
Macro data landed firmly but quietly. Third quarter GDP growth printed at 4.3%, the strongest pace in 2 years, reinforcing the durability of headline momentum. Beneath that strength, real final sales to private domestic purchasers grew at a 3.0% pace, confirming that demand remained solid even after stripping out trade and inventory effects. At the same time, consumer confidence declined again, extending the gap between strong aggregate output and household level sentiment. That disconnect remains one of the defining features of this cycle.
Gold continued to act as the clearest expression of underlying tension after finally flipping the big weekly TRL that had served as the last resort for bears. While equities attempted a restrained Santa rally amid thinning liquidity, gold took center stage, pushing to fresh all-time highs above $4,500 per ounce and extending what is shaping up to be one of the strongest annual performances in decades, with gains running roughly 70% YTD and another solid advance during the holiday week itself. If Santa had to pick an outfit this year, it would clearly be gold rather than red. The move unfolded alongside firmer energy markets following renewed geopolitical friction around Venezuelan oil flows and against a backdrop of inflation still running above target, with the Fed’s preferred measure accelerating during the third quarter rather than cooling. The bid for gold has been steady rather than emotional, reflecting persistent demand for assets that sit outside earnings visibility and precise policy calibration.
Crypto softened modestly but remained orderly. The breakdown attempt failed, though the bounce never really materialized either. Seems like Santa is not a fan of decentralized finance. Price action reflected consolidation rather than distribution, with volatility contained and no signs of forced selling. In a thin holiday market, that stability mattered more than direction.
The coming week is likely to follow a similar pattern. It is again holiday shortened, liquidity will remain thin, and there are no earnings releases scheduled to force engagement. With few catalysts capable of generating clean signals, it may be a better use of time to step away from the screens rather than force activity into an unresponsive tape. That pause has value. In a couple of weeks, earnings season will return with a flood of new inputs. Price will respond more cleanly to key levels, guidance will reset expectations, and narratives will be tested rather than assumed. The market puzzle never ends, but it rarely stays dull for long. Enjoy the quiet while it lasts.
2. Playbook Podcast Spotlight
3. Key Index Charts
In this section I highlight only the most important zones with brief comments. I use fully layered charts to identify them, but keep the charts here clean for clarity.
A false breakout in gold quickly gave way to the real one, while a failed breakdown in crypto left more questions than answers. Despite the holiday shortened week, there were still a few interesting developments worth paying attention to, so let’s go to the charts:
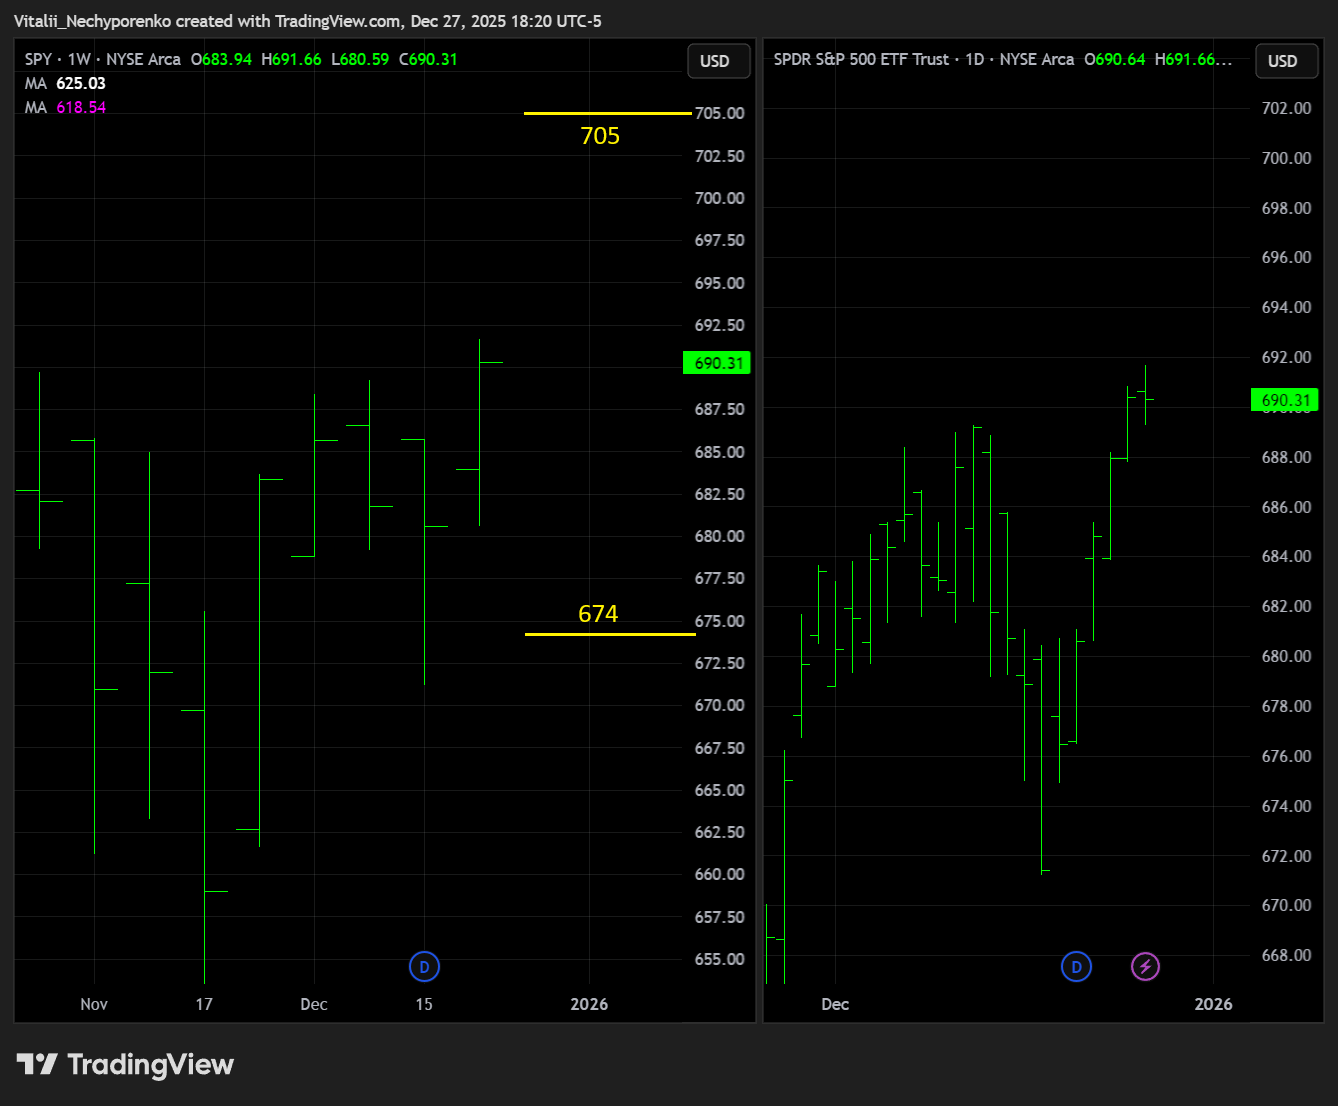
SPY
The S&P 500 ETF finally climbed to a new all time high, even if the move itself does not feel like a breakout at all. Still, a new high is a new high, and there is nothing bearish in the way it was achieved. The next key resistance area to watch sits around 705, where 2 major weekly TRLs converge. On the downside, key support has shifted higher toward 674, where the prior pivot high aligns with the rising UTL.
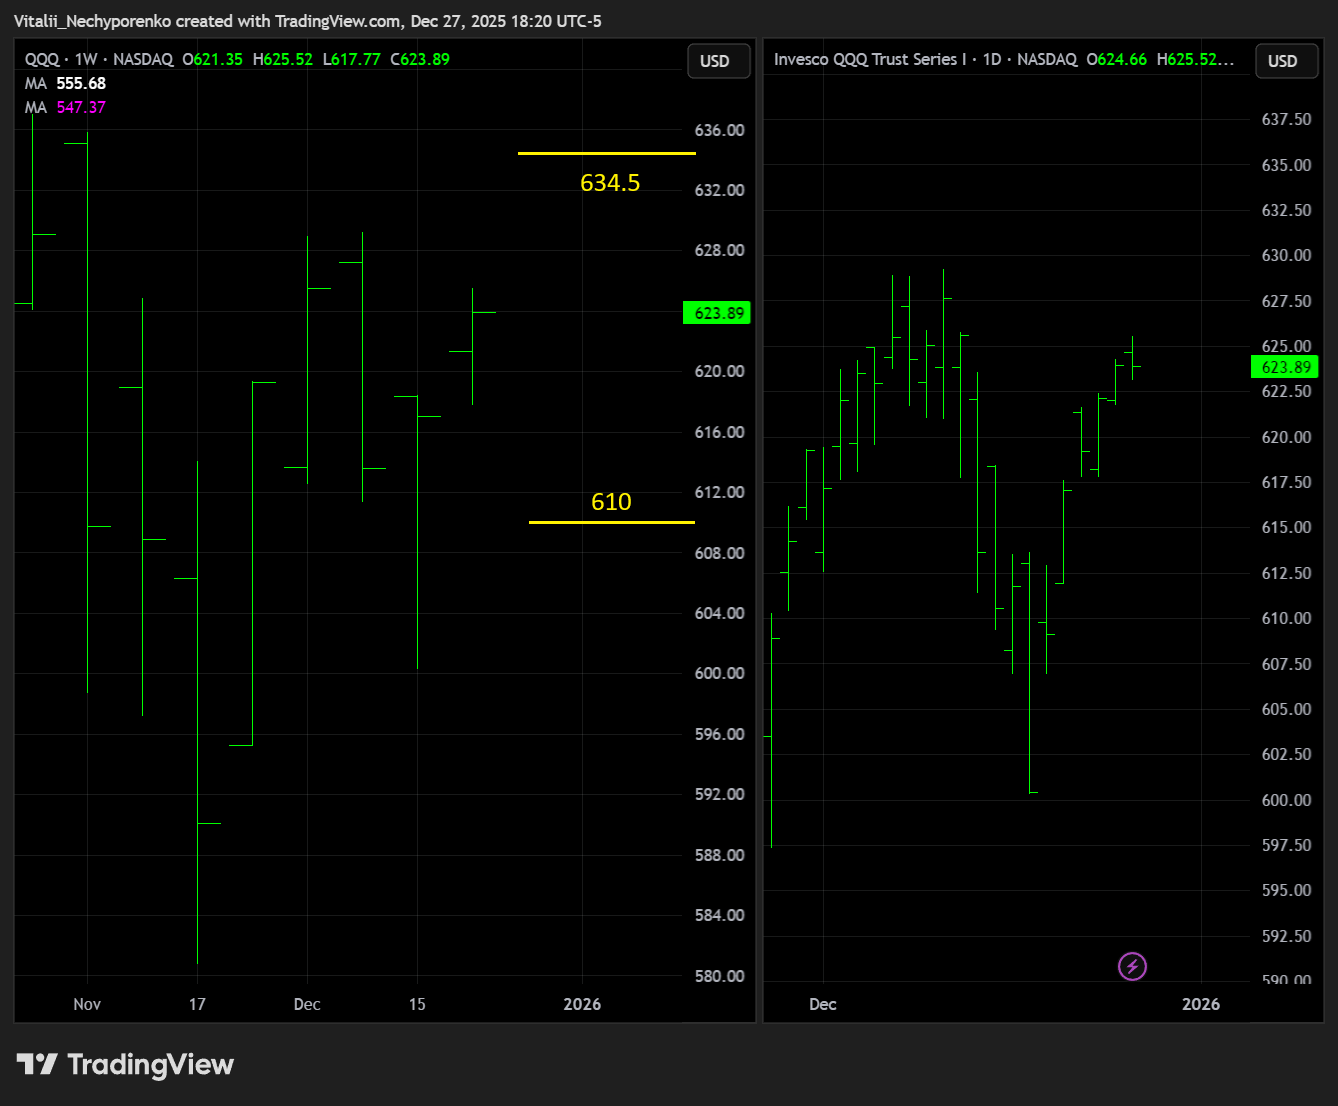
QQQ
The Nasdaq 100 ETF is approaching a fresh weekly DTL, putting a breakout on watch. However, there are still multiple important layers overhead, so any breakout is likely to face additional tests rather than resolve cleanly. Key resistance shifts higher toward 634.5, in line with the rising TRL angle, while key support also moves up to 610.
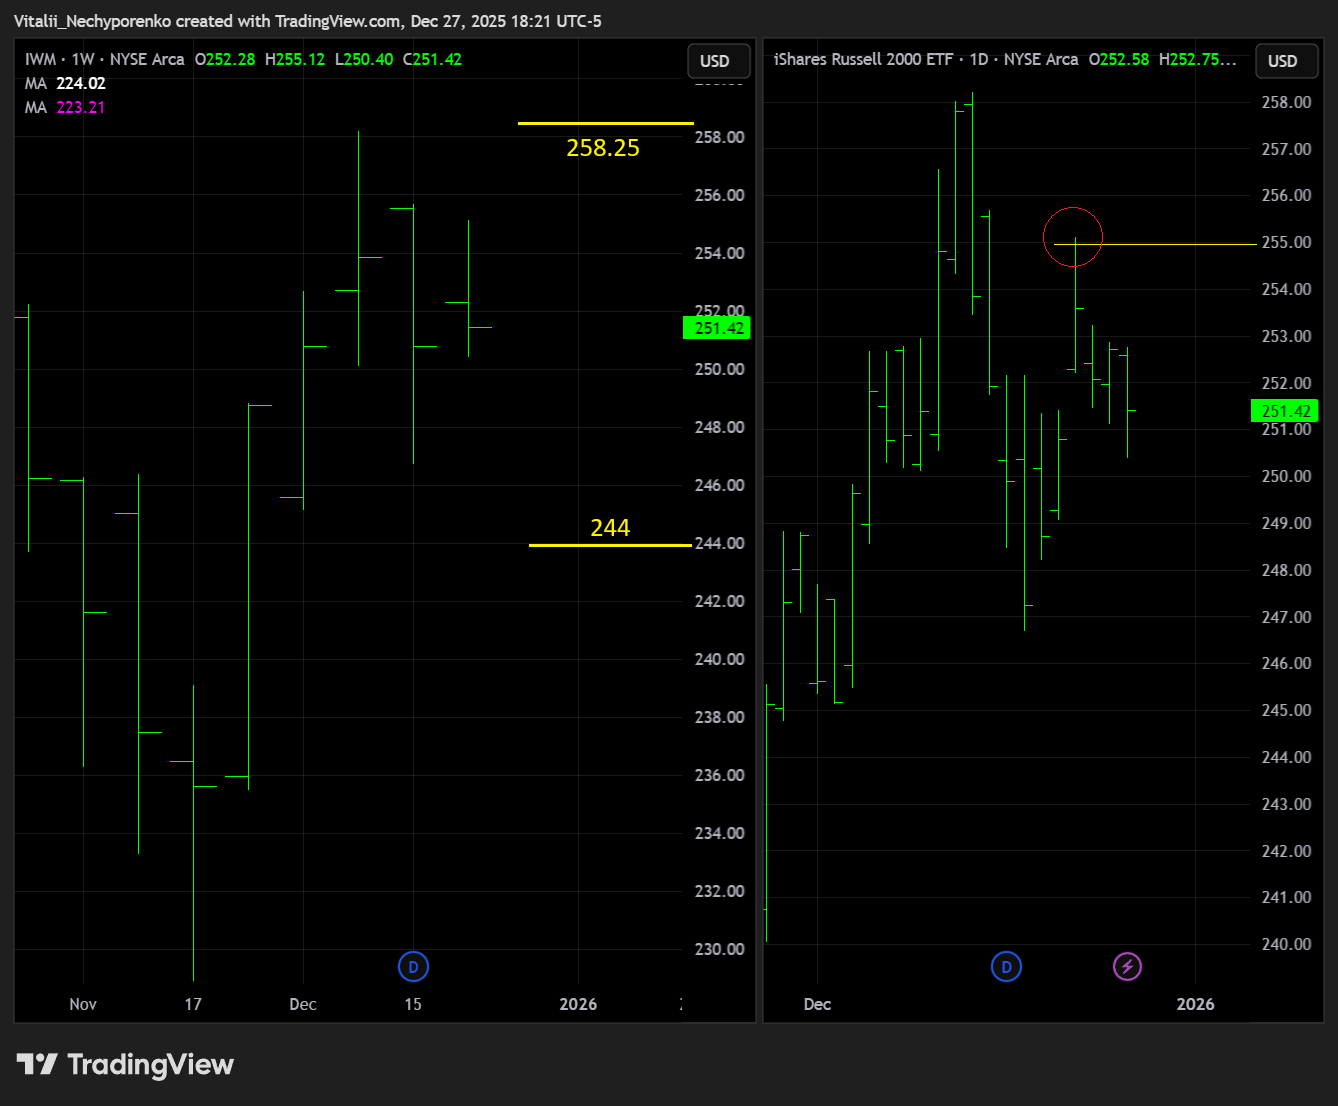
IWM
The Russell 2000 ETF offered a clean fading opportunity on Monday, with a clear rejection at the previously mentioned key resistance around 255. The focus now is on whether that rejection sees follow through toward key support near 244, or whether the resistance is flipped. While this zone can remain reactive, the next key area to watch sits at the all time high near 258.25.
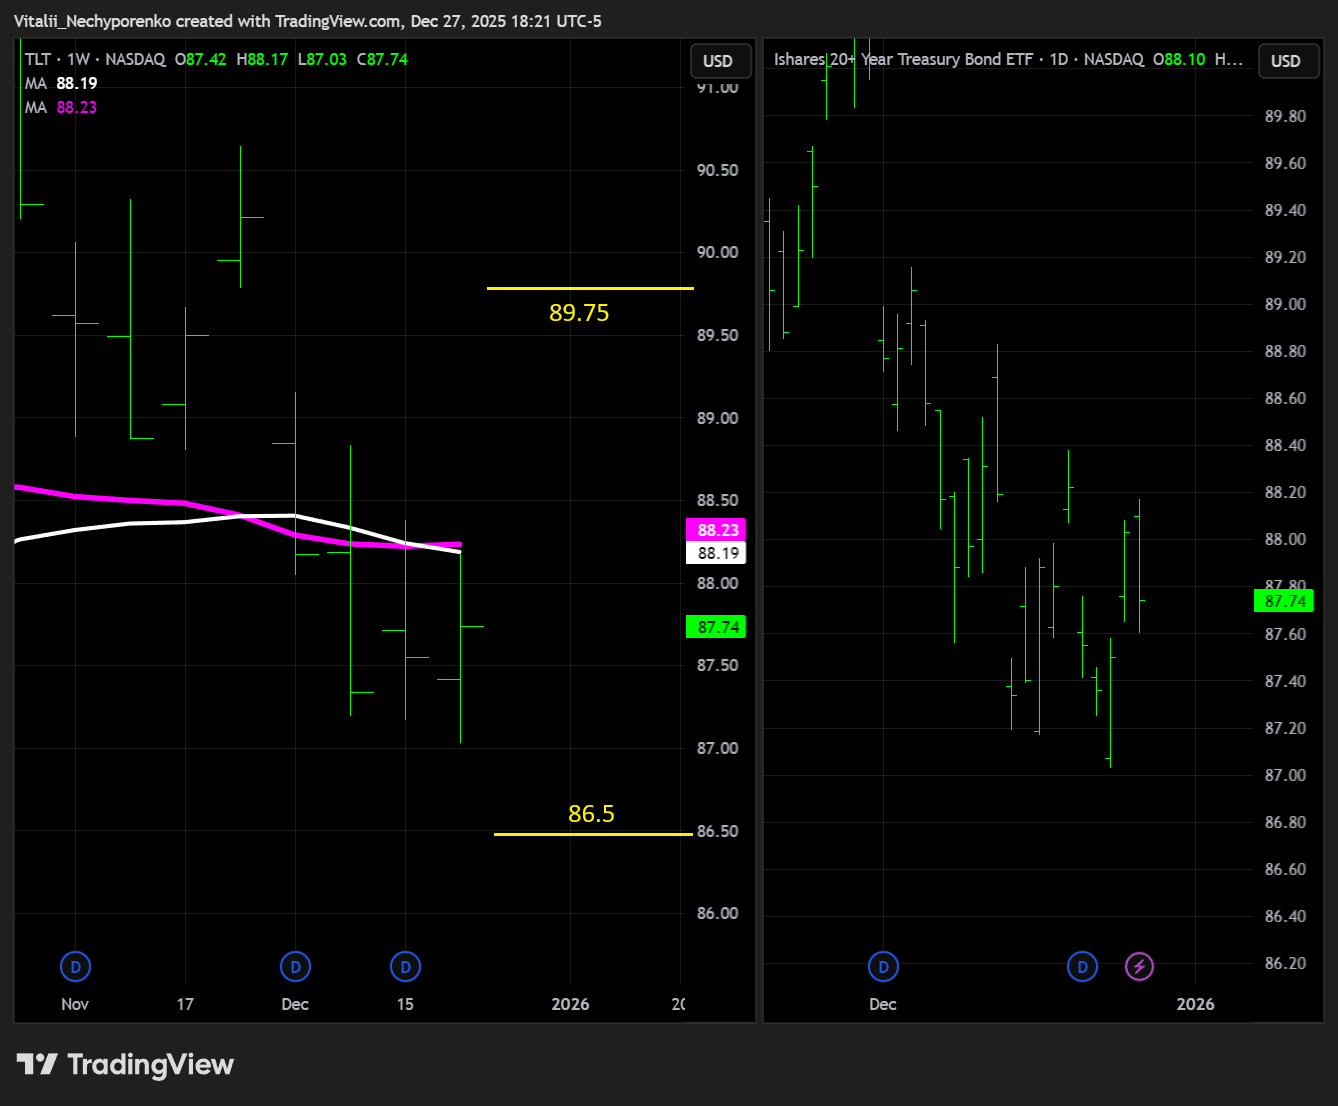
TLT
The 20+ Year Treasury Bond ETF continues to hover around the 200 day moving average. The key question is whether price can finally flip it to the upside. Support has shifted higher toward 86.5, while key resistance is also moving up to 89.75.
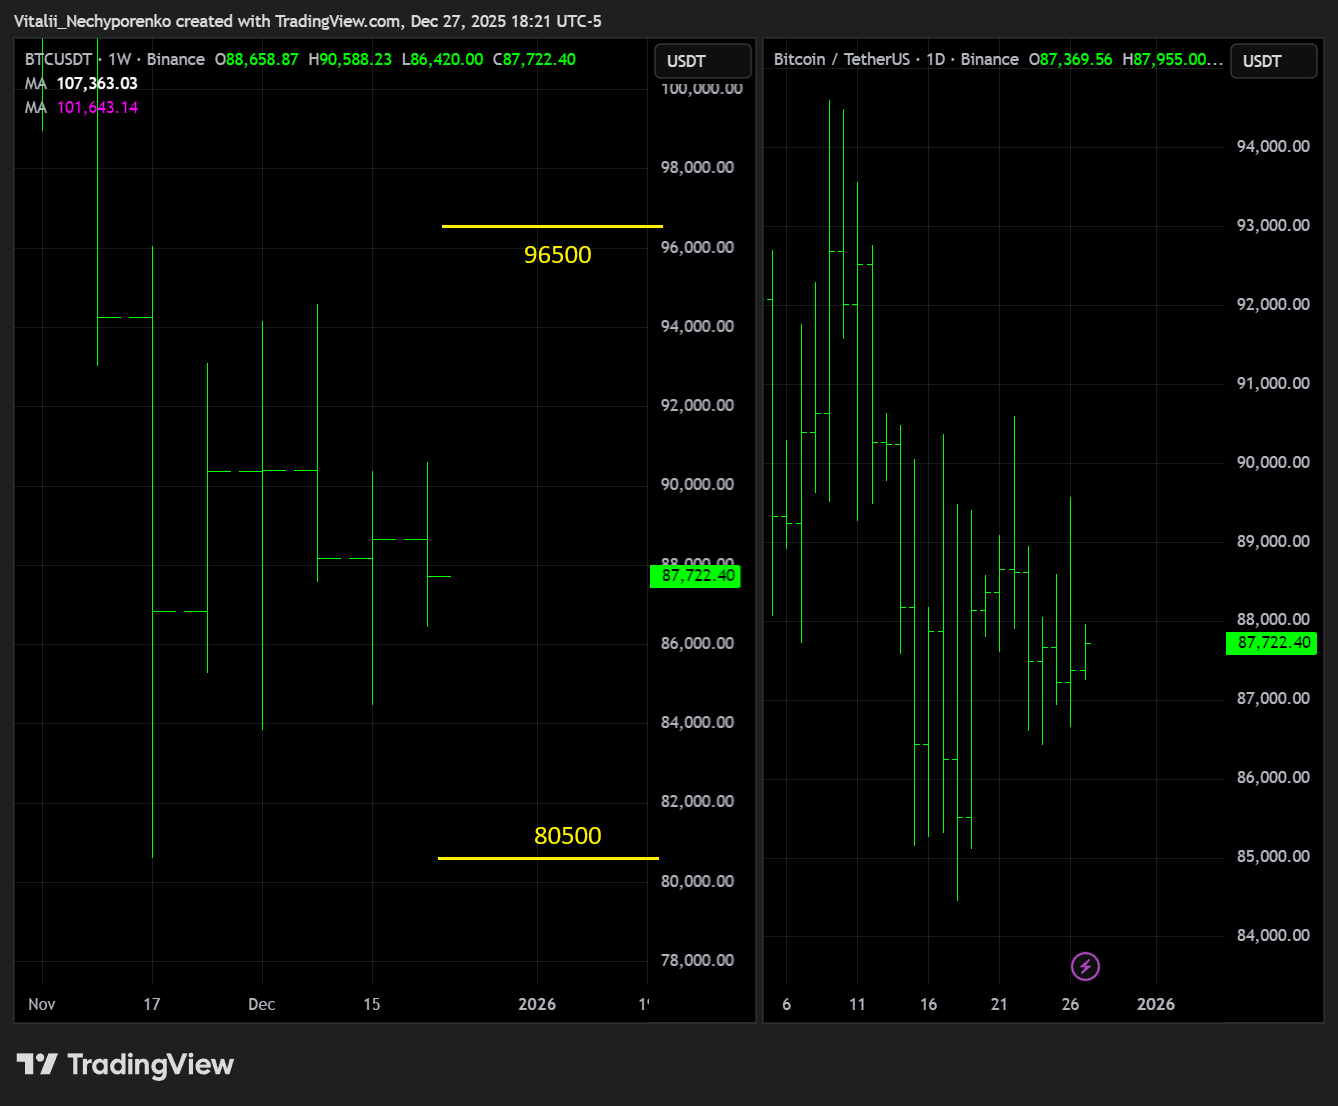
BTC
Bitcoin was not the dinner topic at either Thanksgiving or Christmas. Let’s see if the New Year changes that, hopefully in less than a full year. Key resistance shifts slightly lower to 96500, aligning with the recent 2025 POC, while key support remains unchanged at 80500.
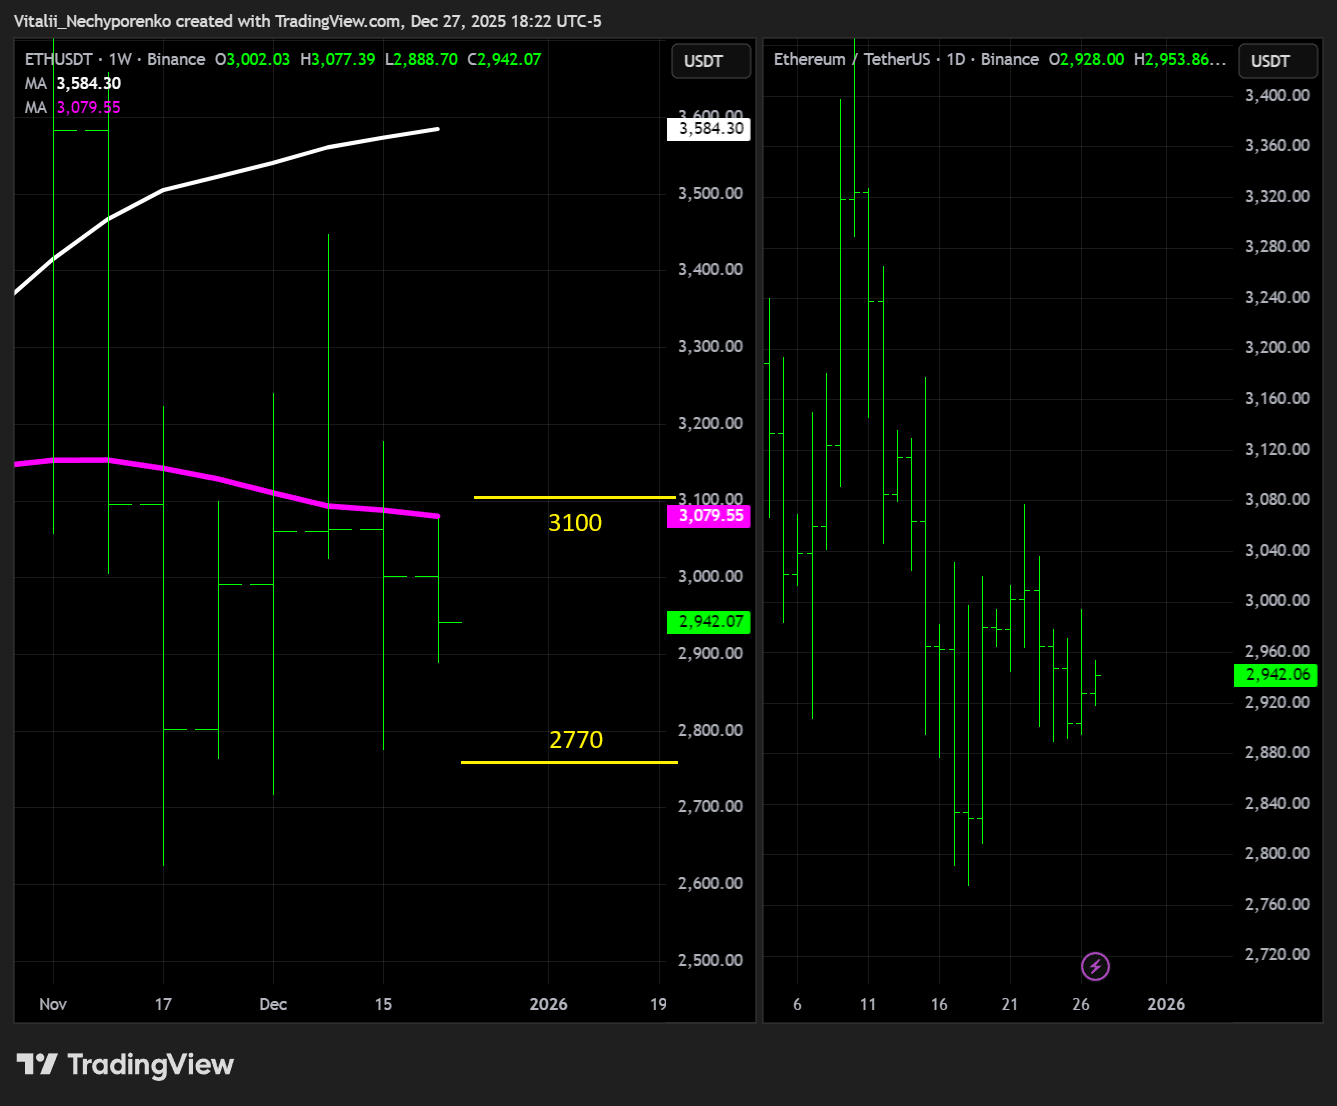
ETH
Ethereum once again looks more controlled, though whether it can move independently of its bigger brother remains an open question. Either way, key resistance, or at least the main reference point, shifts lower to 3100, while key support moves higher to 2770. Let’s see which side wins here.
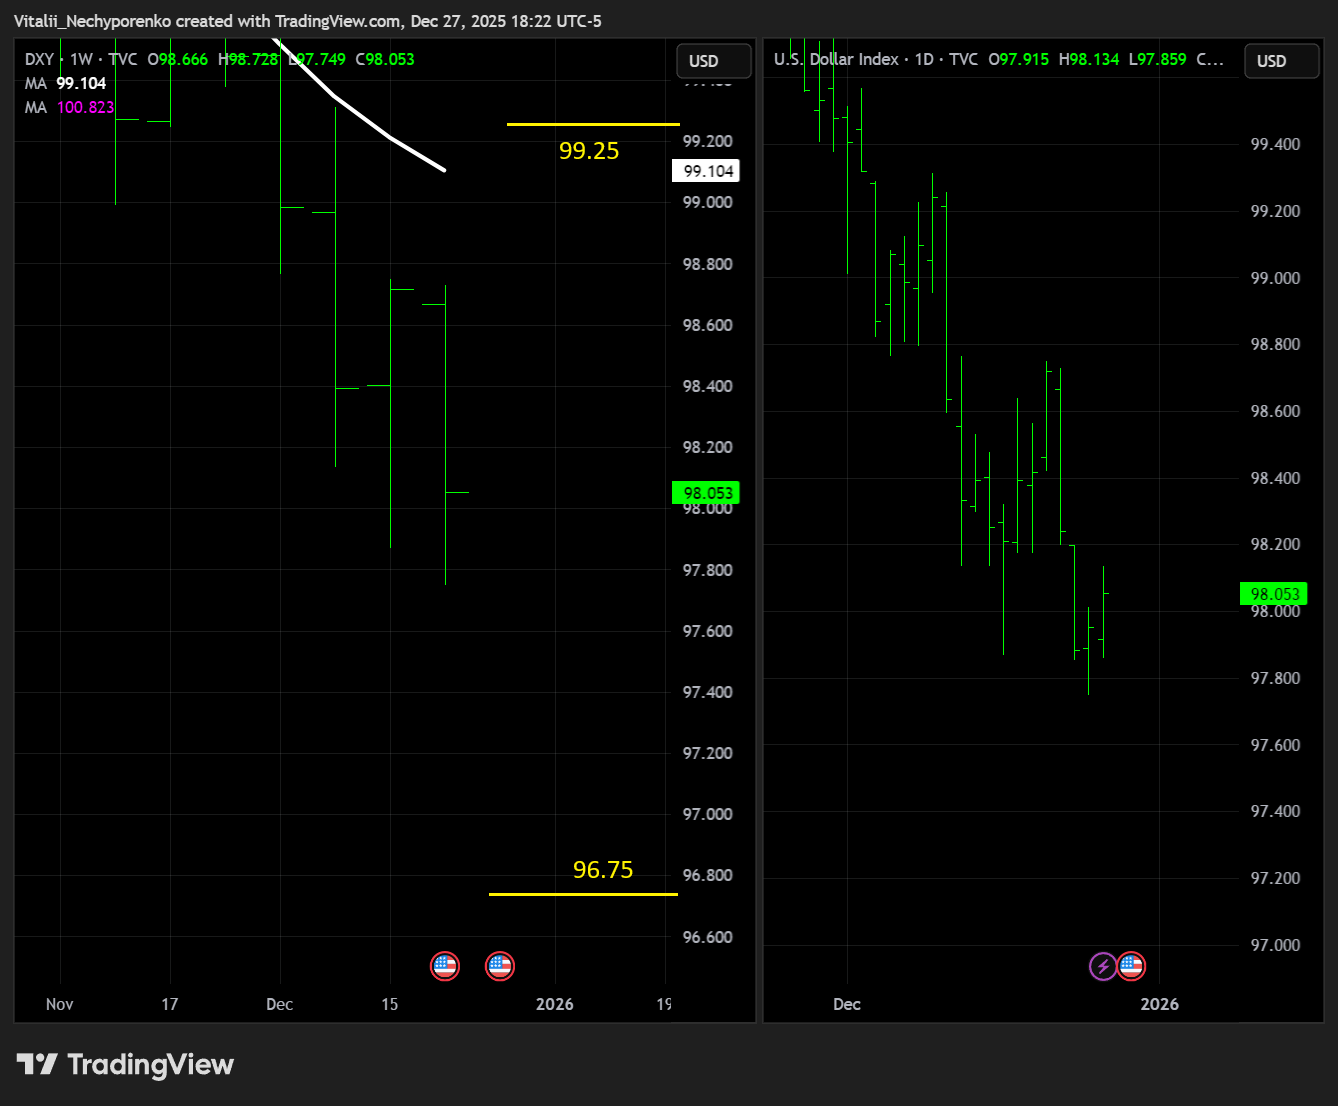
DXY
The dollar’s strength flipped to weakness almost instantly, though it now looks like a false breakdown. If 97.5 gives way, the next support to watch sits at 96.75, while key resistance shifts slightly lower to 99.25.
4. Earnings & Interesting Movers Recap
There is not much to cover this week, so there is no point in putting this behind a paywall. We will dig into 1 chart, and since it happens to be gold itself, it might sound a little weird, but it is better to be a gold digger than a cherry picker😁
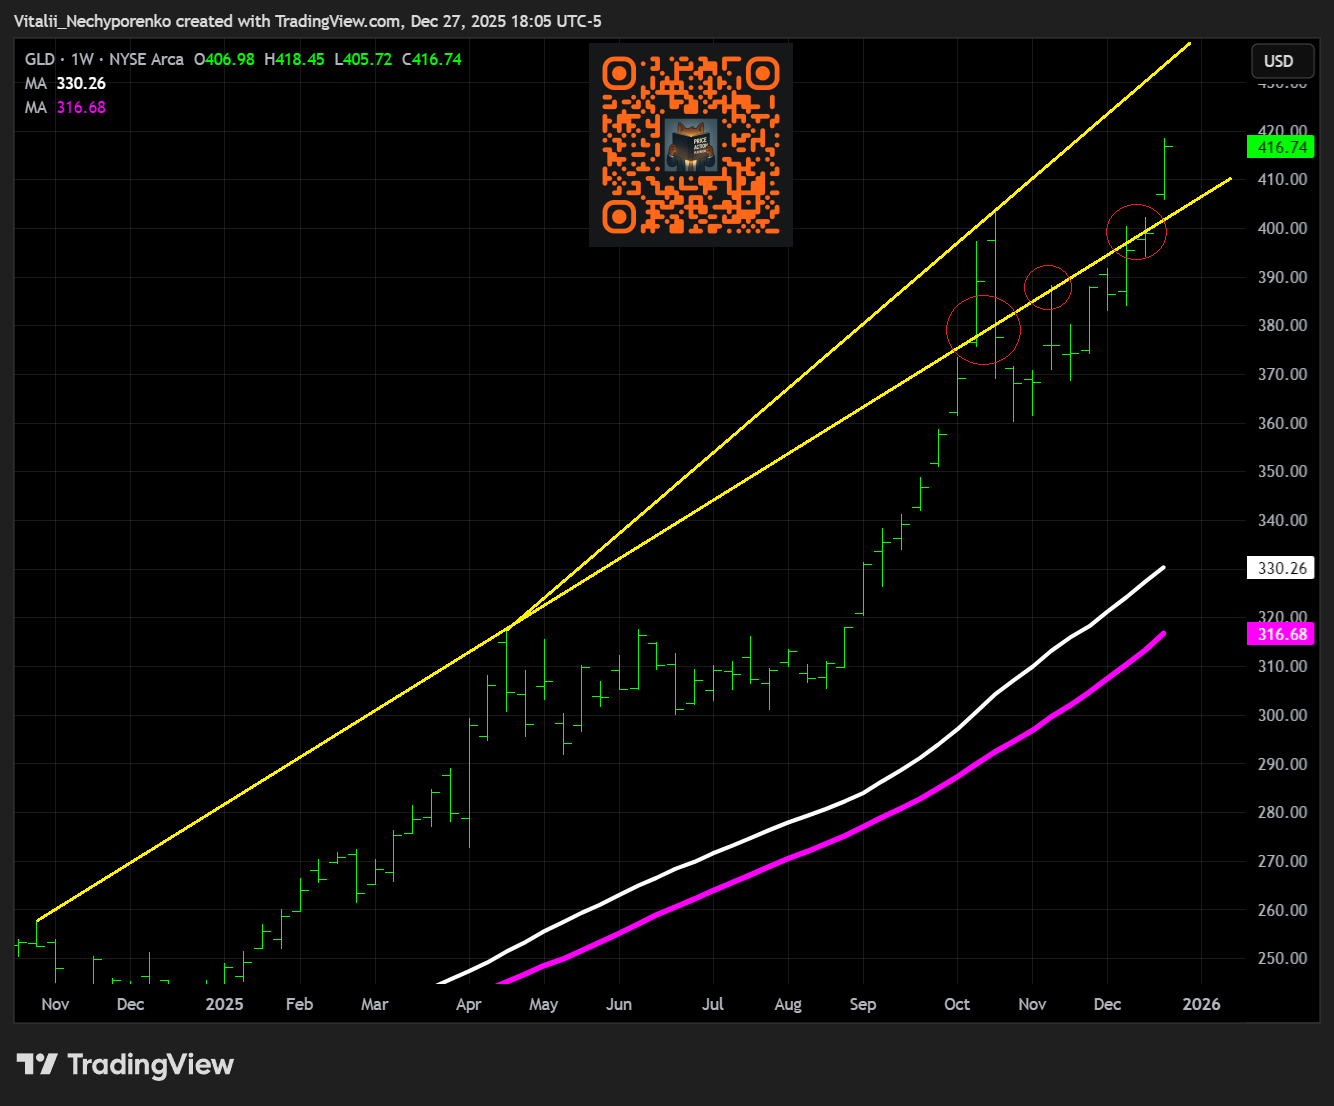
Here is the big weekly TRL I have been highlighting multiple times, which has finally flipped. Reactions around this level should be watched closely. Once flipped, these levels often start acting as support and can offer decent bounce opportunities, assuming they can actually hold.
There is not much overhead supply above this area. The steeper TRL remains unproven for now and looks more like a line in the sand than something actionable, though the reaction to 425-430 area is worth monitoring.
That’s all for today. Enjoy the holidays, and see you next year!

Disclaimer:
This report is intended solely for informational and educational purposes and reflects independent commentary and analysis by the author. The author is not affiliated with any company mentioned in this report and holds no positions on the board of any related entities. All opinions, analyses, and insights expressed are the author’s alone and should not be interpreted as specific investment advice, a solicitation to buy or sell securities, or an endorsement of any particular investment strategy.The information provided is derived from sources and research the author deems reliable, but its accuracy, completeness, or timeliness is not guaranteed. Readers should not rely on this report as the sole basis for any financial decisions. The author disclaims any liability to update or revise the content as new information becomes available.
Investing involves significant risks, including the potential for loss of principal. Past performance does not guarantee future results. Investments or strategies discussed may not suit every individual’s circumstances, and they may fluctuate in price or value. This report does not consider your specific financial objectives, risk tolerance, or personal investment needs. Readers are encouraged to conduct their own research and consult with a qualified financial or investment advisor before making any investment decisions.
The author and any associated entities do not guarantee specific outcomes or profits from the use of this report. The author may or may not hold open positions in the securities mentioned. By reading this report, you acknowledge the risks involved and accept the limitations of the information presented.