


Key Takeaways This Week
Quadruple Witching and delayed macro data increase the risk of mechanical volatility
Pressure continues to build in crowded AI trades
The Fed cut supported sentiment, but long term yields still reflect fiscal and inflation risks
Last week’s movers: GEV, ORCL, SNPS, LULU and AVGO
Earnings to watch this week: MU, ACN, FDX and NKE
Table of Contents
Market Overview
Playbook Podcast Spotlight
Key Index Charts
Earnings & Interesting Movers Recap
Earnings to Watch This Week
1. Market Overview
Price action this week continued to diverge between what the indexes showed and what was happening beneath the surface. Headline performance softened, but the internal rotation that began earlier this month remained intact. Large cap growth lost leadership, while value, equal weight, and smaller capitalization stocks quietly absorbed flows. What looked like indecision at the index level was, in reality, a market redistributing risk rather than abandoning it.
The S&P 500 finished down 0.6% and the Nasdaq fell 1.6%, with nearly all of the damage concentrated in AI exposed mega caps. Renewed concern around the sustainability of AI spending and margin expansion weighed on sentiment, but those declines masked continued strength elsewhere. Equal weight indices and small caps posted gains, and the Russell 2000 pushed to new highs, a notable signal given its sensitivity to easing financial conditions and relative valuation support. Participation is broadening, even as leadership becomes more unstable.
Volatility picked up early in the week as positioning adjusted ahead of the Fed meeting. That tension eased midweek after the Fed delivered a 25 bp cut and maintained flexibility around further easing. The combination of policy relief, resilient economic data, and expectations for lighter regulatory pressure in parts of the financial system encouraged further rotation away from crowded AI trades toward cyclicals, financials, and value oriented exposures. The market response suggested confidence in the direction of policy, if not the pace.
That confidence was tested once earnings took center stage. Oracle’s pullback early in the week set a cautious tone, reinforcing the idea that AI related growth is no longer immune to valuation scrutiny. Broadcom’s reaction on Friday drove the point home. Despite beating expectations and guiding higher, the stock sold off sharply, reminding investors that mega cap tech is priced for near flawless execution. The information technology sector ended the week down 2.9%, semiconductors fell 5.1%, and technology stood alone as the only sector to decline more than 1.0%. The weakness was narrow, but the message was clear. Concentrated positioning leaves little room for narrative shifts.
Despite that volatility, broader risk signals remained calm. Volatility measures stayed near low historical levels, credit markets showed no signs of stress, and defensives attracted only incremental flows. This was not a systemic risk off move. It was a leadership reset. Still, rising volatility within growth and persistent underperformance of market cap weighted indexes versus equal weight measures highlight how fragile consensus positioning has become.
The macro backdrop adds complexity heading into year end. A delayed and unusually dense data slate means November jobs and inflation reports will arrive in close succession, compressing market reactions into a narrow window. That compression coincides with Quadruple Witching, when stock options, index options, single stock futures, and index futures all expire simultaneously. These events routinely amplify volume, exacerbate short term volatility, and expose underlying positioning. In a market already dealing with leadership fragmentation, Quadruple Witching increases the risk of sharp, mechanical moves that are disconnected from fundamentals.
This matters more than usual. Positioning remains heavy in a handful of growth names, while rotation trades are still relatively fresh. Forced re hedging, dealer gamma shifts, and index related flows during expiration can easily overwhelm fundamentals in the short term. A benign macro read could reinforce rotation and support further upside. A surprise in either jobs or inflation could turn expiration mechanics into an accelerant rather than a release valve.
On the policy side, the Fed’s most consequential action last week drew little attention. Treasury bill purchases resumed at roughly $20 bln per month, officially framed as routine reserve management. When reinvestments from agency MBS paydowns are included, effective demand for bills could approach $60 bln per month. At that pace, annual Fed absorption could reach $240 to $300 bln, covering a substantial share of total bill issuance. While not labeled quantitative easing, the impact on issuance composition is meaningful, allowing a higher reliance on bills alongside expanded buybacks of older long dated securities.
Markets remain unconvinced that policy easing alone can suppress long term yields. Despite cumulative rate cuts totaling 1.75 points since September 2024, longer dated yields continue to rise. The 10 year remains above pre easing levels, and the widening gap between 10 and 30 year yields suggests investors are pricing fiscal risk and inflation persistence rather than near term policy relief. Higher global yields, particularly abroad, reduce foreign demand for US Treasuries and add pressure to the long end.
Speculative undercurrents continue to build as well. Reports pointing to a potential SpaceX IPO in 2026 have already reignited interest across Musk affiliated companies. With SpaceX privately valued near $400 bln and ambitions reportedly far higher, any move toward public markets would ripple through Tesla, xAI, and related platforms. Recent shareholder approval allowing Tesla to invest in xAI signals growing openness to cross ownership, tying future growth narratives more tightly to AI driven infrastructure, autonomy, and robotics.
As the year closes, the market faces a familiar but more fragile setup. Leadership is shifting, volatility is rising where positioning is crowded, and macro catalysts are clustering into a narrow window alongside expiration mechanics. Rotation remains constructive, but the margin for error is thinner than it appears. Nothing is breaking yet, but the next few weeks will test whether broadening participation can offset the instability created when consensus trades finally lose their grip.
2. Playbook Podcast Spotlight
3. Key Index Charts
In this section I highlight only the most important zones with brief comments. I use fully layered charts to identify them, but keep the charts here clean for clarity.
Rotation might be the word of the week, and the fact that crypto is holding up relatively well amid the bloodbath in some highfliers is also worth noting. Now let’s go to the charts:
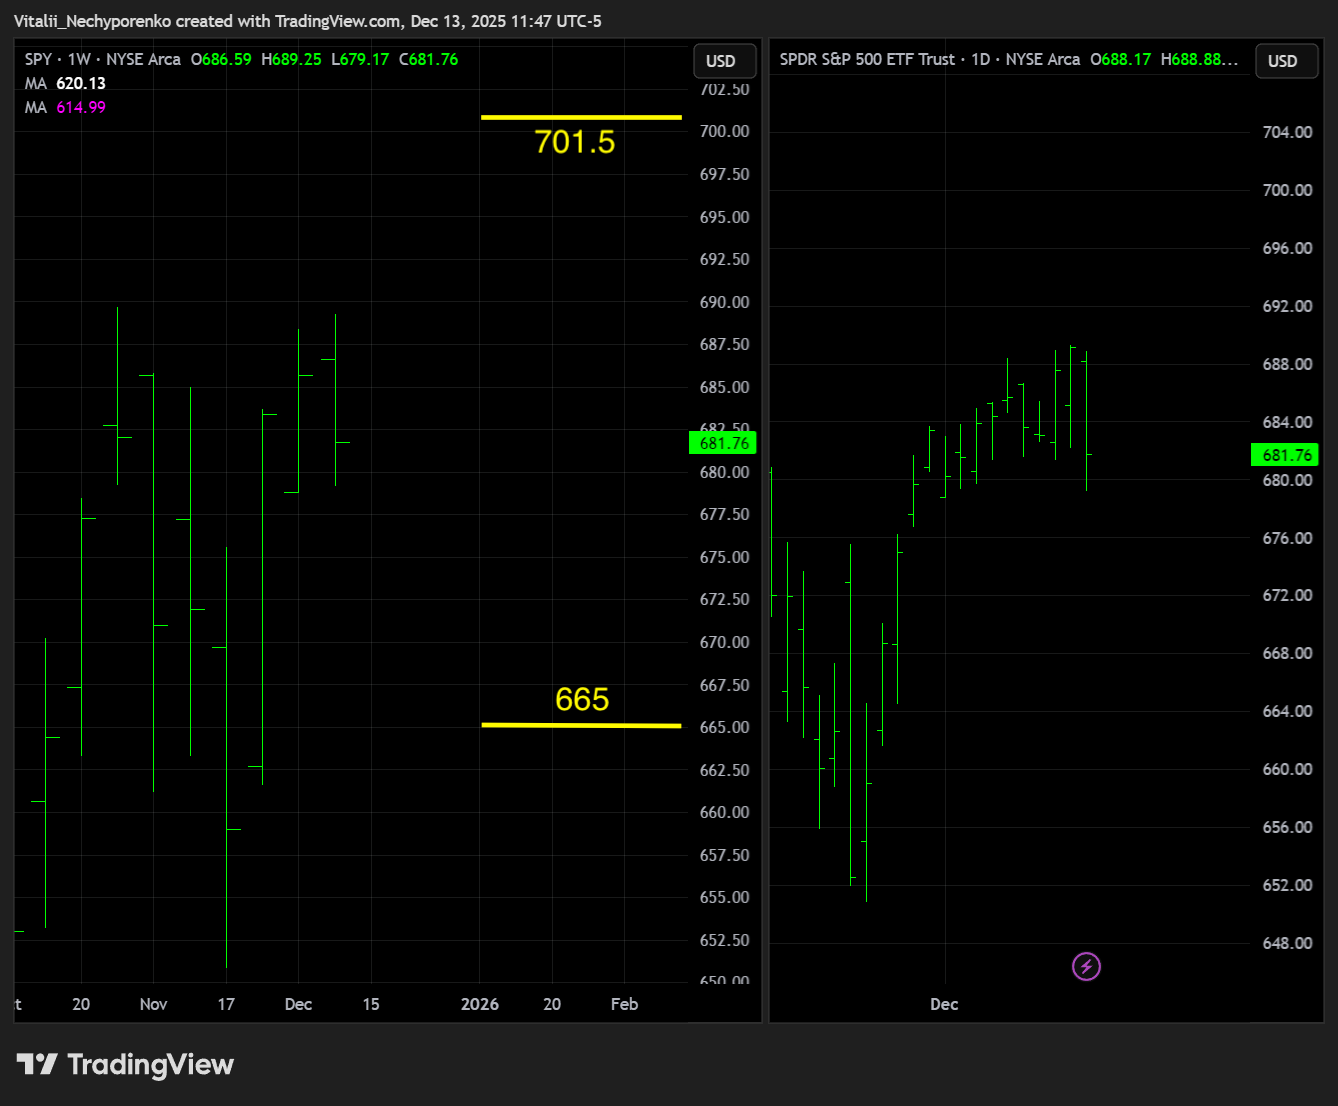
SPY
The S&P 500 ETF didn’t even briefly touch the ATH despite being close. The reaction there remains on watch unless we see followthrough from Friday’s selling. Key resistance shifts slightly to 701.5, while key support moves lower to 665, which is a more layered area.
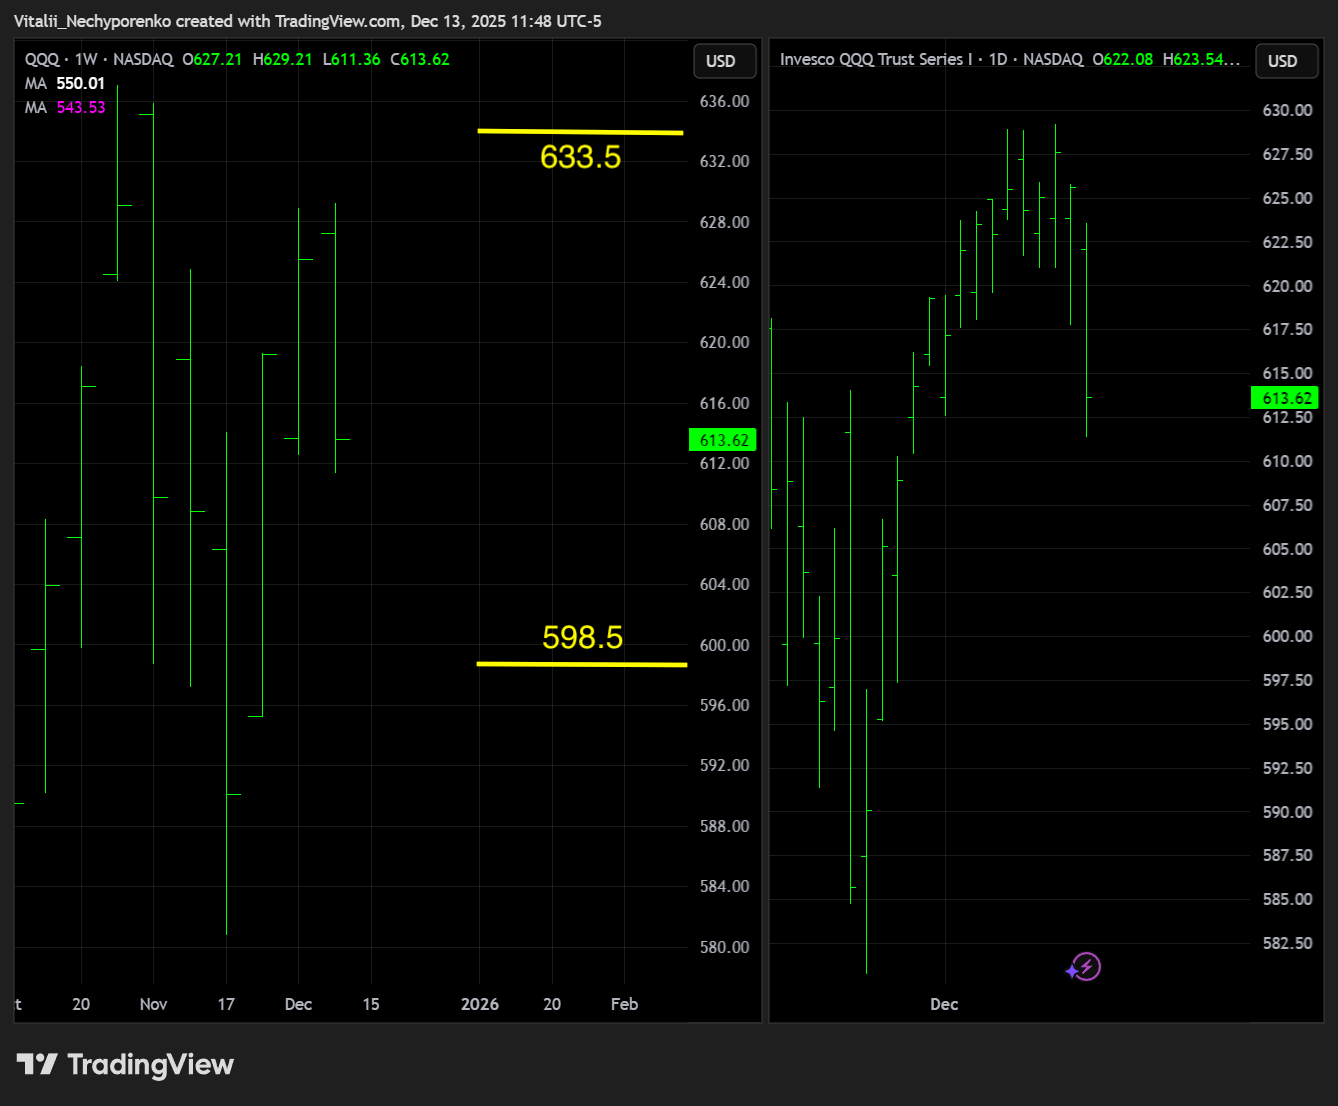
QQQ
The previously mentioned 627.50 reference point in the Nasdaq 100 ETF turned out to be solid resistance and acted accordingly. The reaction there should be watched closely if revisited, while the weekly trendline shifts slightly higher to 633.5 given the angle. QQQ closed slightly above the 612.5 support, with the next support area to watch at 598.5.
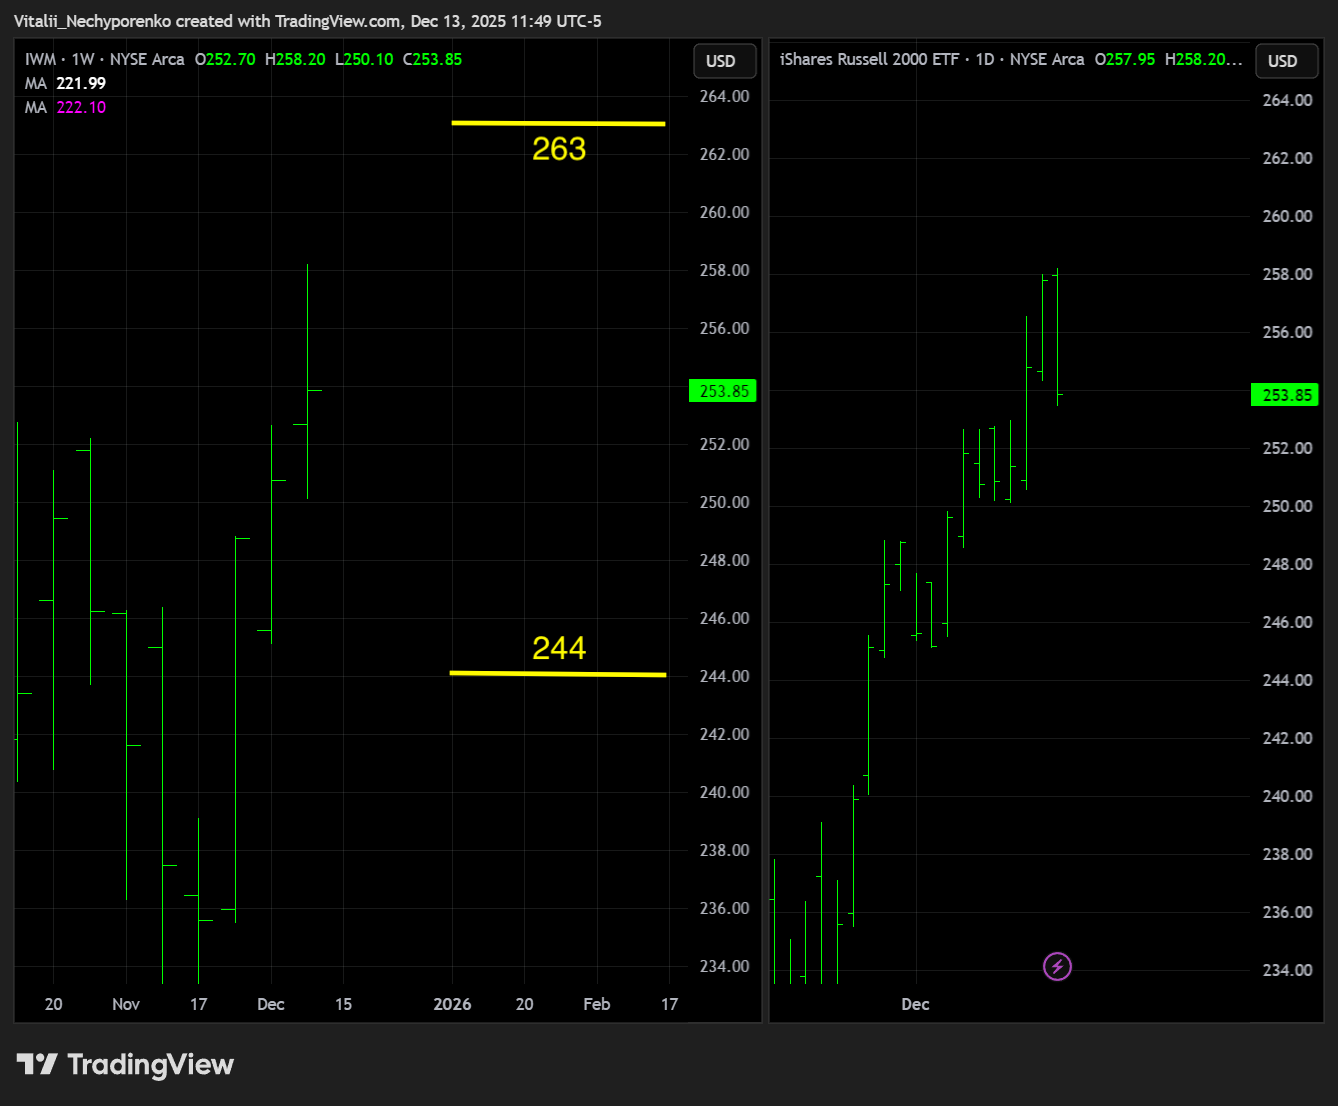
IWM
The Russell 2000 ETF finally cleared the ATH and sold off from the mentioned key resistance area at 257.5, though the reaction was delayed and muted, looking more like part of the broader selloff rather than a technically driven move. While the area is still worth watching, the next key resistance sits closer to 263, and key support shifts slightly to 244.
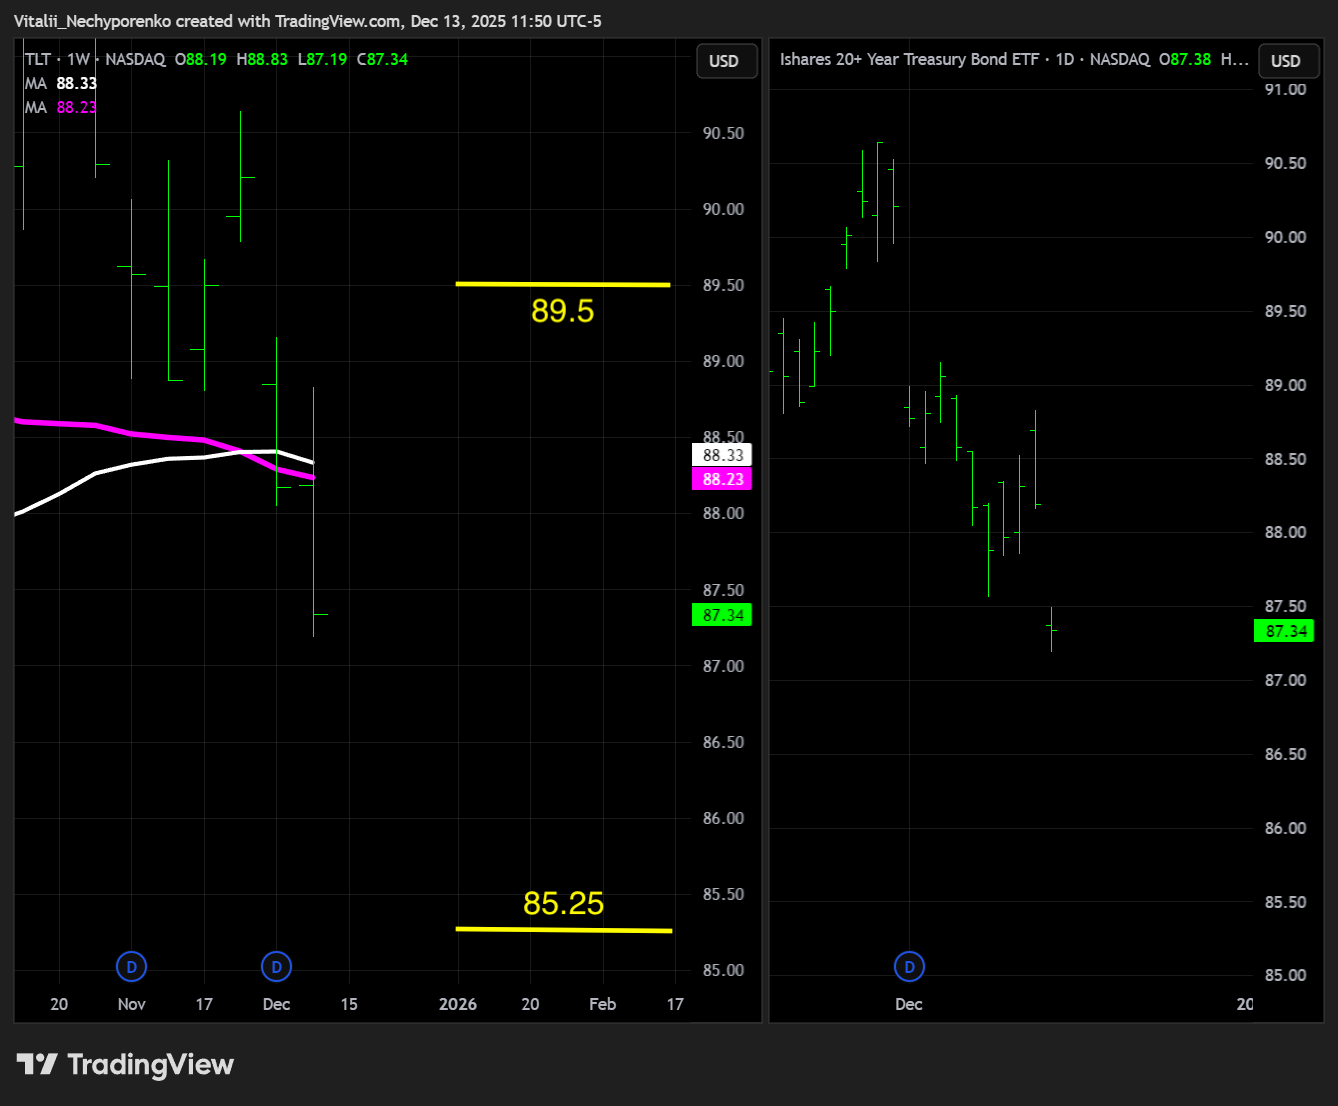
TLT
The 20+ Year Treasury Bond ETF made things worse despite edging higher post Fed. It closed right at the mentioned support area around 87.25, and while 86.50 looks interesting, the bigger support sits at 85.25 if we get another followthrough from here. Key resistance stays the same at 89.50.
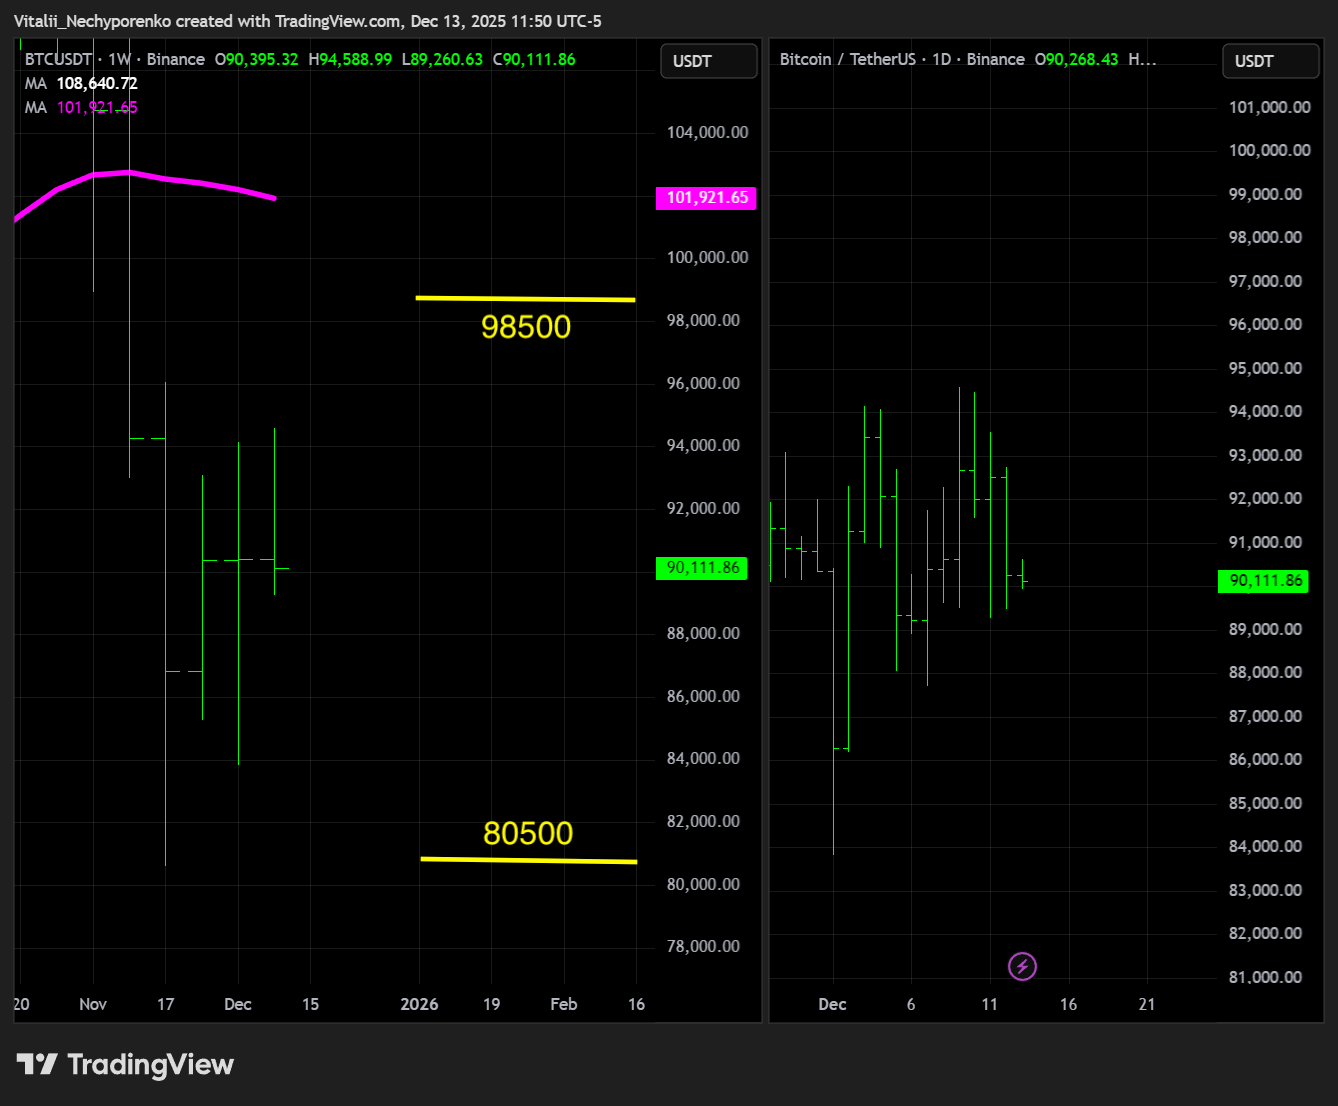
BTC
While the overall pattern in Bitcoin looks Big and Bearish, it was not invited to the bloodbath party, which is not a bad sign after all. The consolidation will eventually break one way or another. Key support shifts slightly higher to the recent pivot low around 80500, while key resistance moves to 98500 in line with the weekly trendline angle.
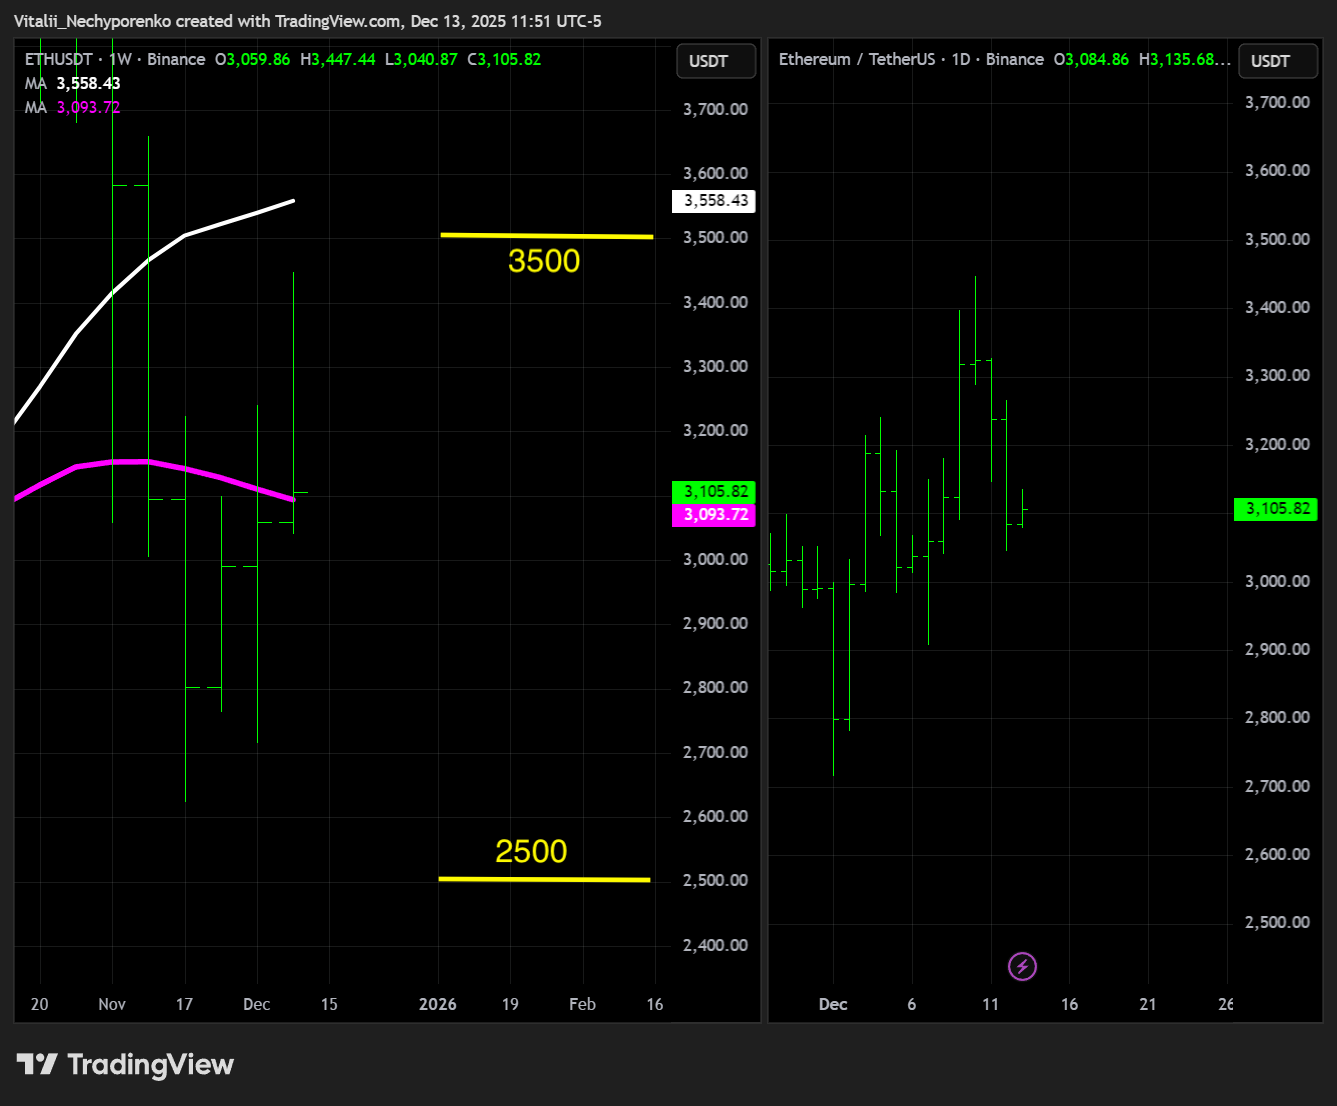
ETH
Ethereum looks even better, slightly outperforming the big brother, though the overall setup remains the same, with key support at 2500 and key resistance at 3500.
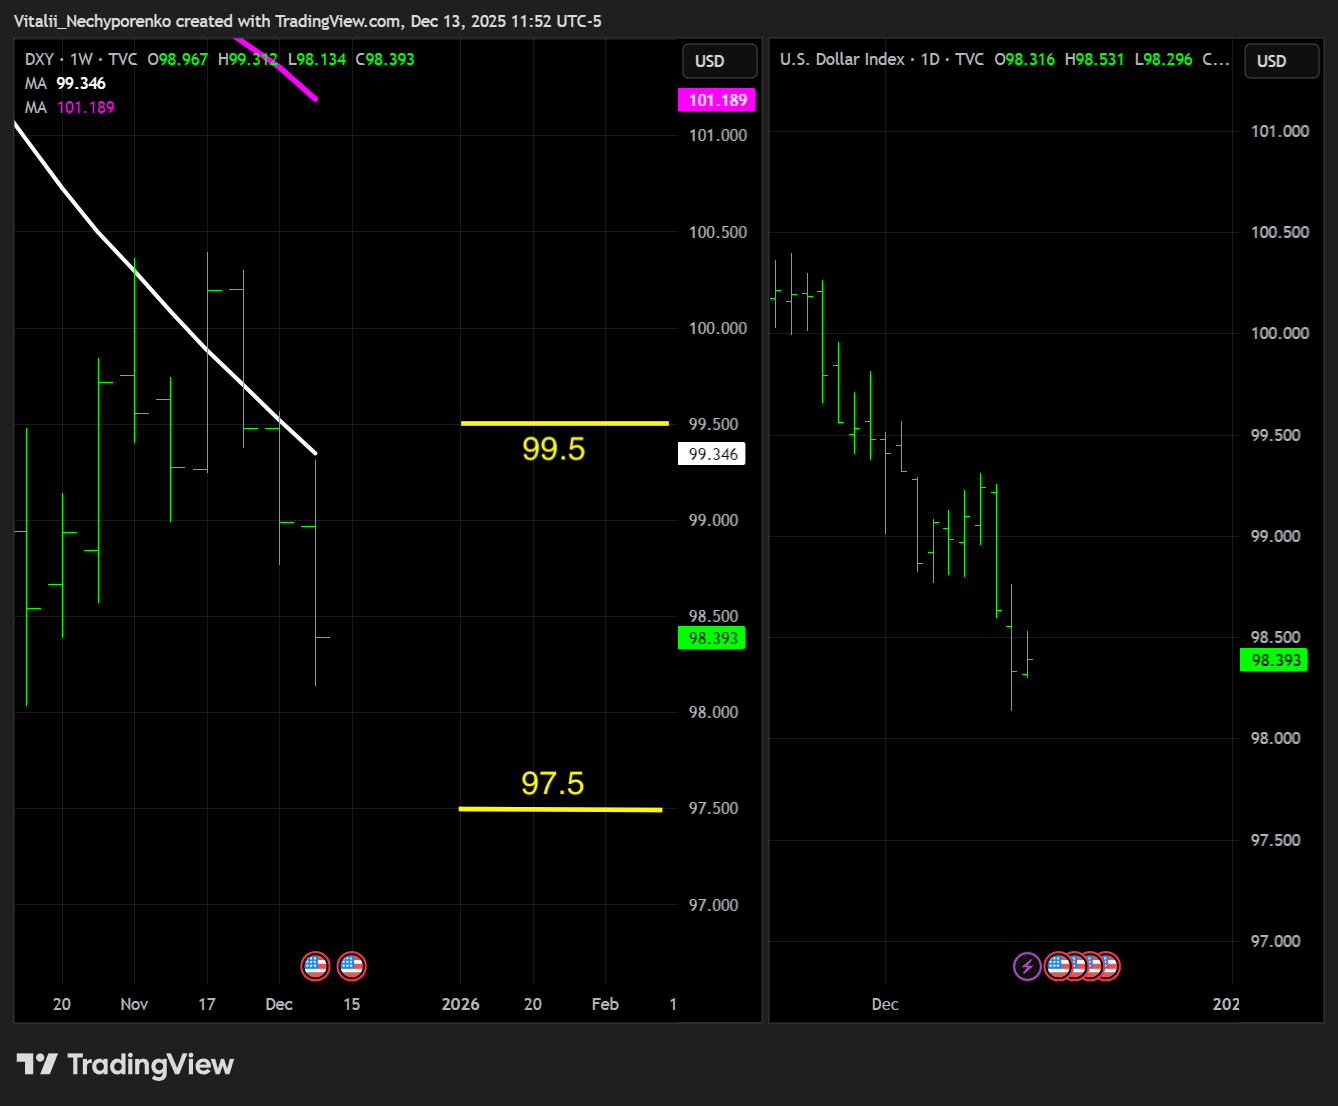
DXY
The dollar slid lower after the Fed and looks like the reaction to the key 97.5 support will come sooner than expected. Key resistance, meanwhile, shifts to 99.50.
4. Earnings & Interesting Movers Recap
GEV
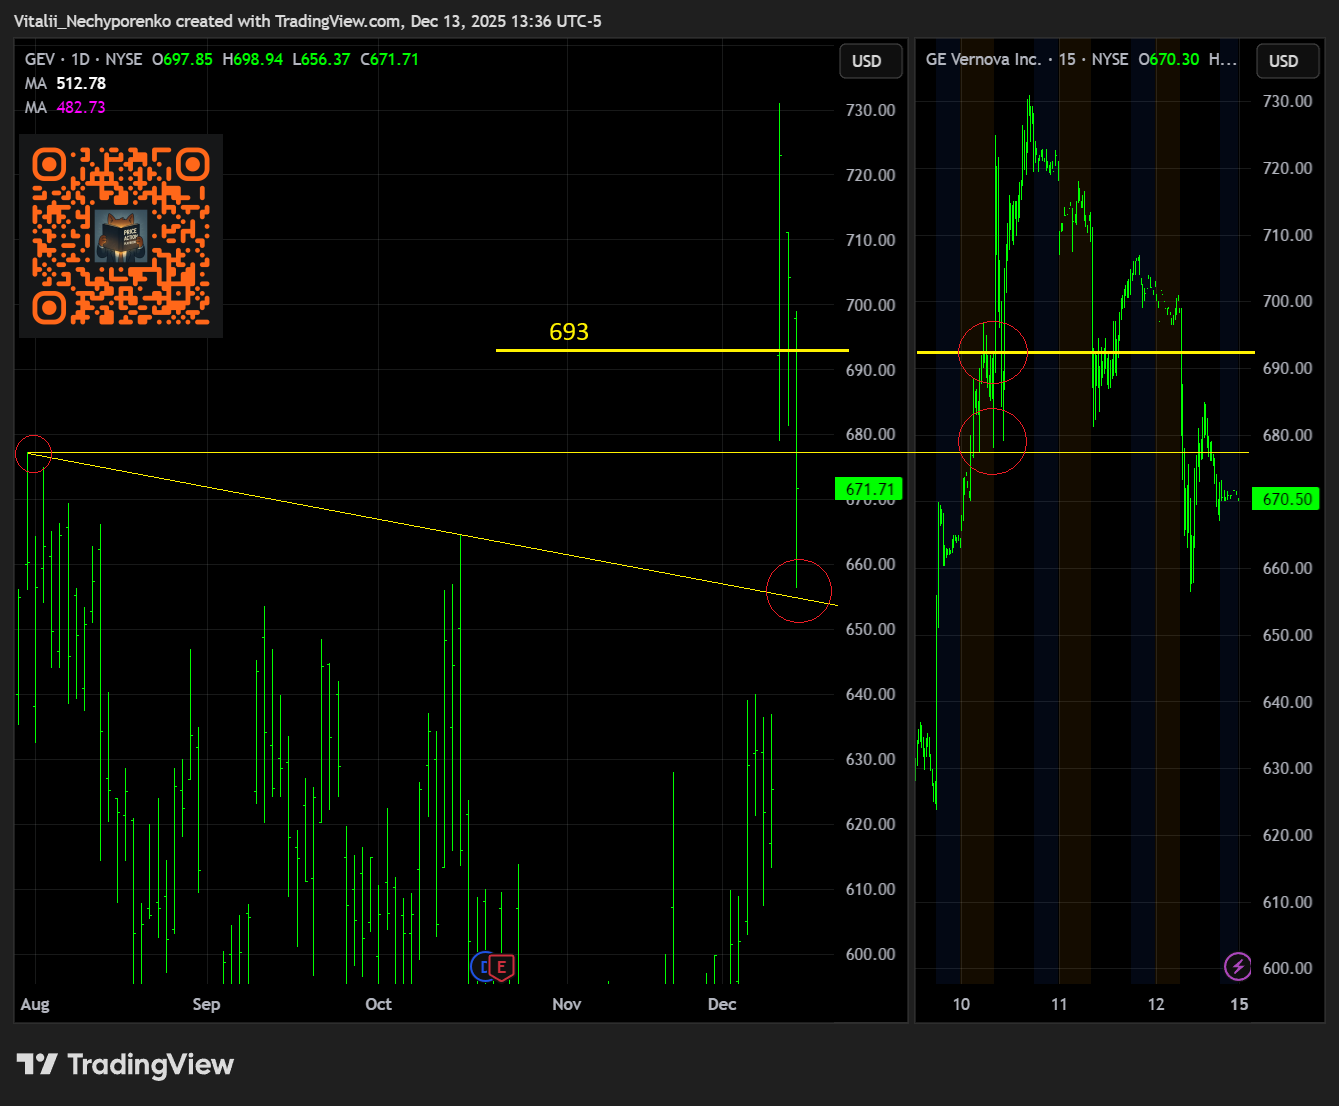
GE Vernova reaffirmed its FY25 revenue outlook, issued in line FY26 guidance, and introduced long term targets that reflect accelerating demand for power infrastructure. Management expects equipment and services backlog to approach $200 bln by 2028, supported by grid modernization, nuclear and renewables expansion, added gas capacity, and rising U.S. electricity demand from data centers, AI compute, and broader electrification. Capital returns were increased with the quarterly dividend doubled to $0.50 per share and a new $10 bln buyback authorization, underpinned by rising free cash flow expectations despite elevated investment in automation, robotics, and AI to improve manufacturing efficiency and margins over time.
I highlighted the weekly TRL around 693 in the Premarket Price Action Snapshot that day as the key level to watch. The stock dipped to the prior ATH amid a couple of reference price shifts, though late buy orders came in and the open printed right at 693.00😁 The rip followed immediately, although the tape moved viciously and we had another backtest of the lows before pushing higher once again. It did break below the area on Friday, backtesting the prior DTL before bouncing back. The TRL has now shifted closer to 700 with the angle and should remain on watch.
ORCL
Oracle reported its strongest revenue growth in 10 quarters, with Q2 revenue up 14.2% yr over yr to $16.06 bln, driven by continued acceleration in cloud. OCI revenue grew 66% yr over yr in constant currency, lifting total cloud revenue to $8 bln, or roughly 50% of overall sales, underscoring a meaningful shift in business mix. Remaining performance obligations reached $523.3 bln, up 433% yr over yr and 15% sequentially, supported by large multi year contracts tied to AI infrastructure demand. The main area of concern was cash flow, with free cash flow of $(10) bln as CapEx rose to $12 bln in the quarter and FY26 CapEx guidance was increased by $15 bln, amplifying focus on leverage following the recent $18 bln bond issuance and raising questions around the timing of cash flow normalization.
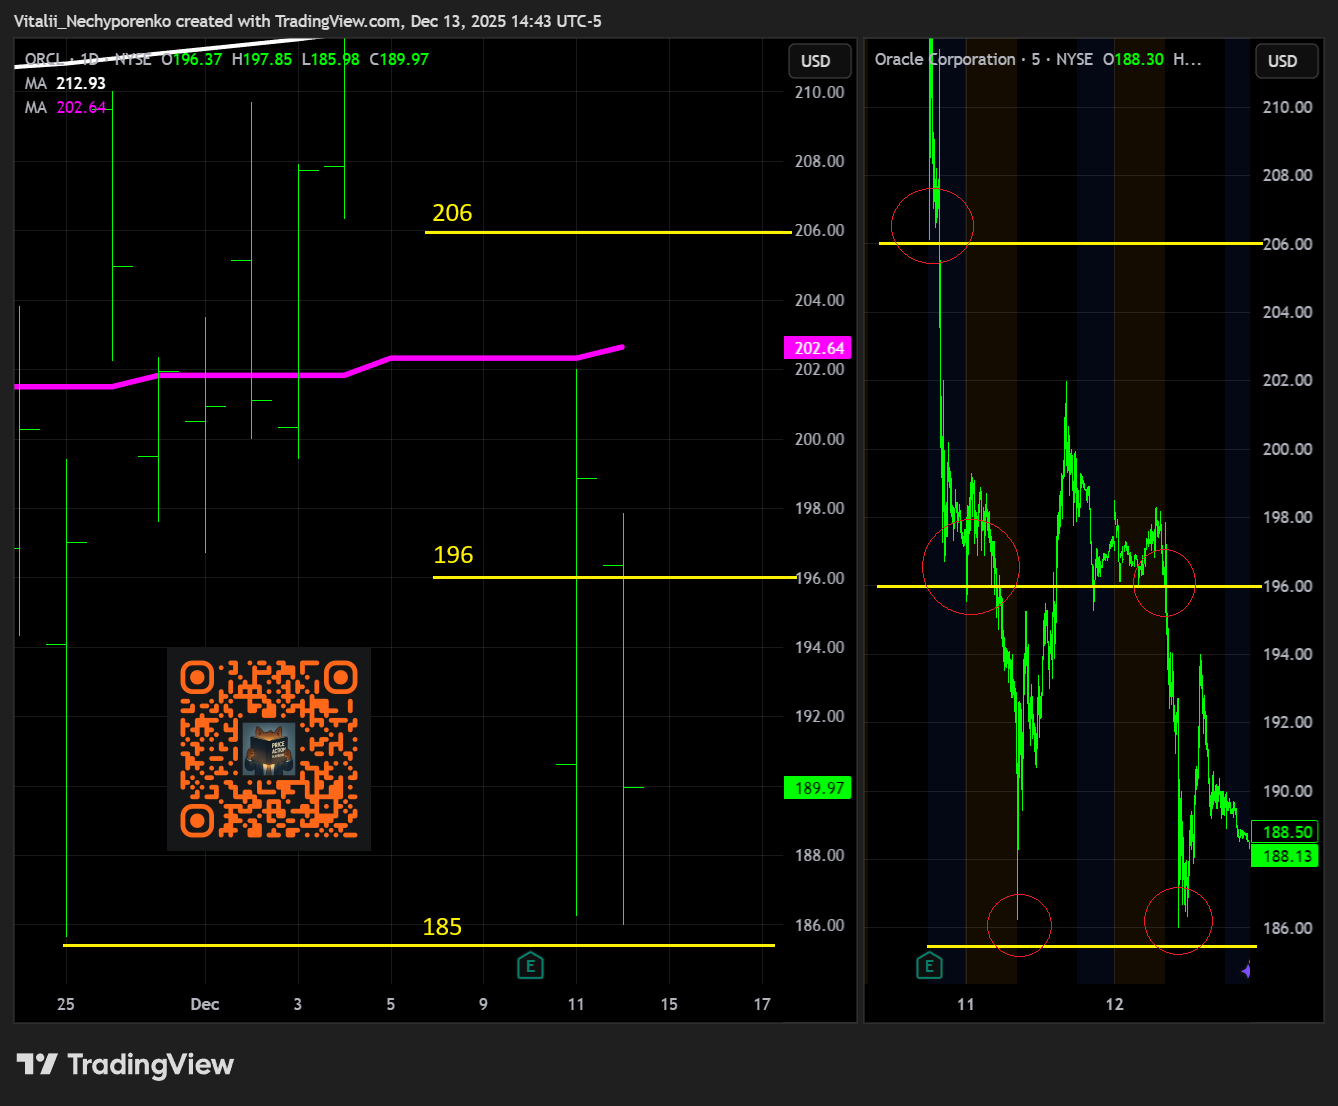
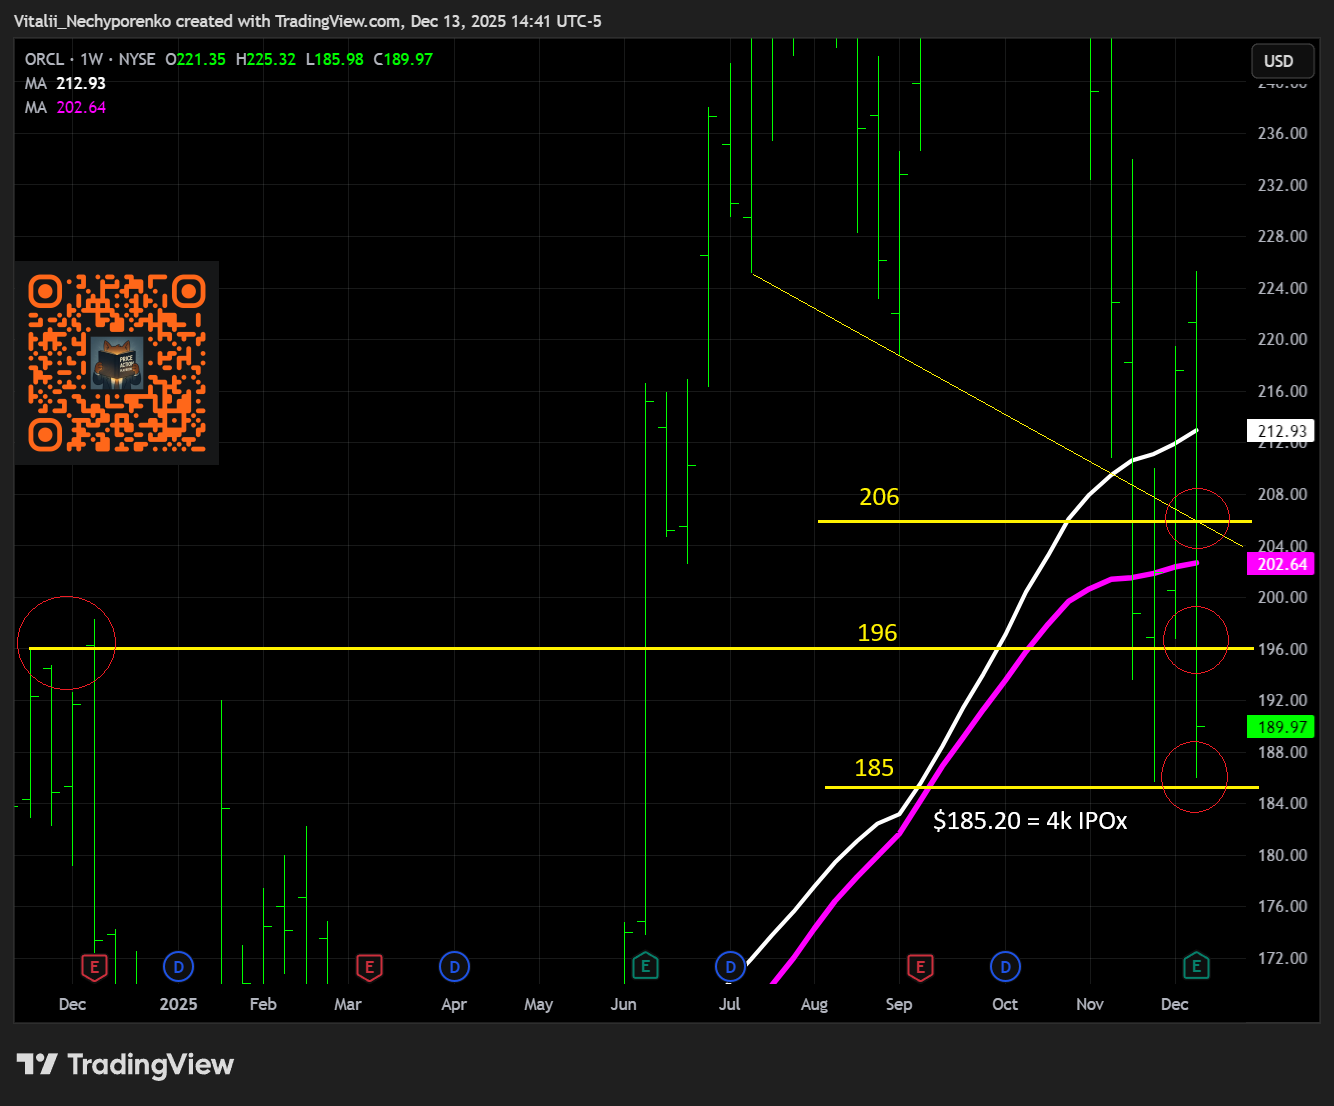
I was highlighting 196 and 185 as key supports over the weekend, though I had to add the minor 206 level in the pre-earnings note as well, since price moved higher ahead of the report. Here is the big picture to explain the logic behind those areas:
How all of this played out was textbook:
The initial reaction at 206 produced a bounce, but the area was later flipped and triggered a sharp move toward the next level at 196.
In the following premarket, buyers attempted to push back above 196 but could not hold. Once the breakdown was confirmed, selling pressure quickly built and the opening print came in around 190 amid a snowballing sell opening imbalance. The subsequent dip nearly tagged the prior pivot low at 185, where the large 4k IPOx sits, before snapping back.
Buyers then tried to reclaim the area, briefly pushing the stock above 200, but failed to hold it there amid renewed selling. Even so, they managed to close the session back above 196.
That area was broken again on Friday alongside broader market weakness, triggering another sharp dip toward the notorious 185, where buyers once again stepped in. This time, however, the bounce was muted and failed to reclaim 196.
All three areas are worth marking in bold on the chart, setting alerts, and monitoring closely. Price action around these levels will decide what comes next. And so far, it was just awesome in this name.
SNPS
Synopsys delivered a solid Q4, beating EPS by $0.12 while revenue rose 37.8% yr over yr to $2.25 bln, in line with expectations. Guidance was mixed near term but constructive longer term, with Q1 EPS guided above consensus despite slightly softer revenue, and FY26 EPS guided above consensus with revenue in line. Full year guidance incorporates roughly $2.9 bln of expected Ansys revenue and reflects the divestiture of the Optical Solutions Group and PowerArtist RTL businesses, sharpening the company’s focus on its core EDA and IP portfolio. Overall, results reinforced Synopsys position as a key beneficiary of sustained semiconductor and AI related design complexity, even as integration and mix shifts temper near term revenue visibility.
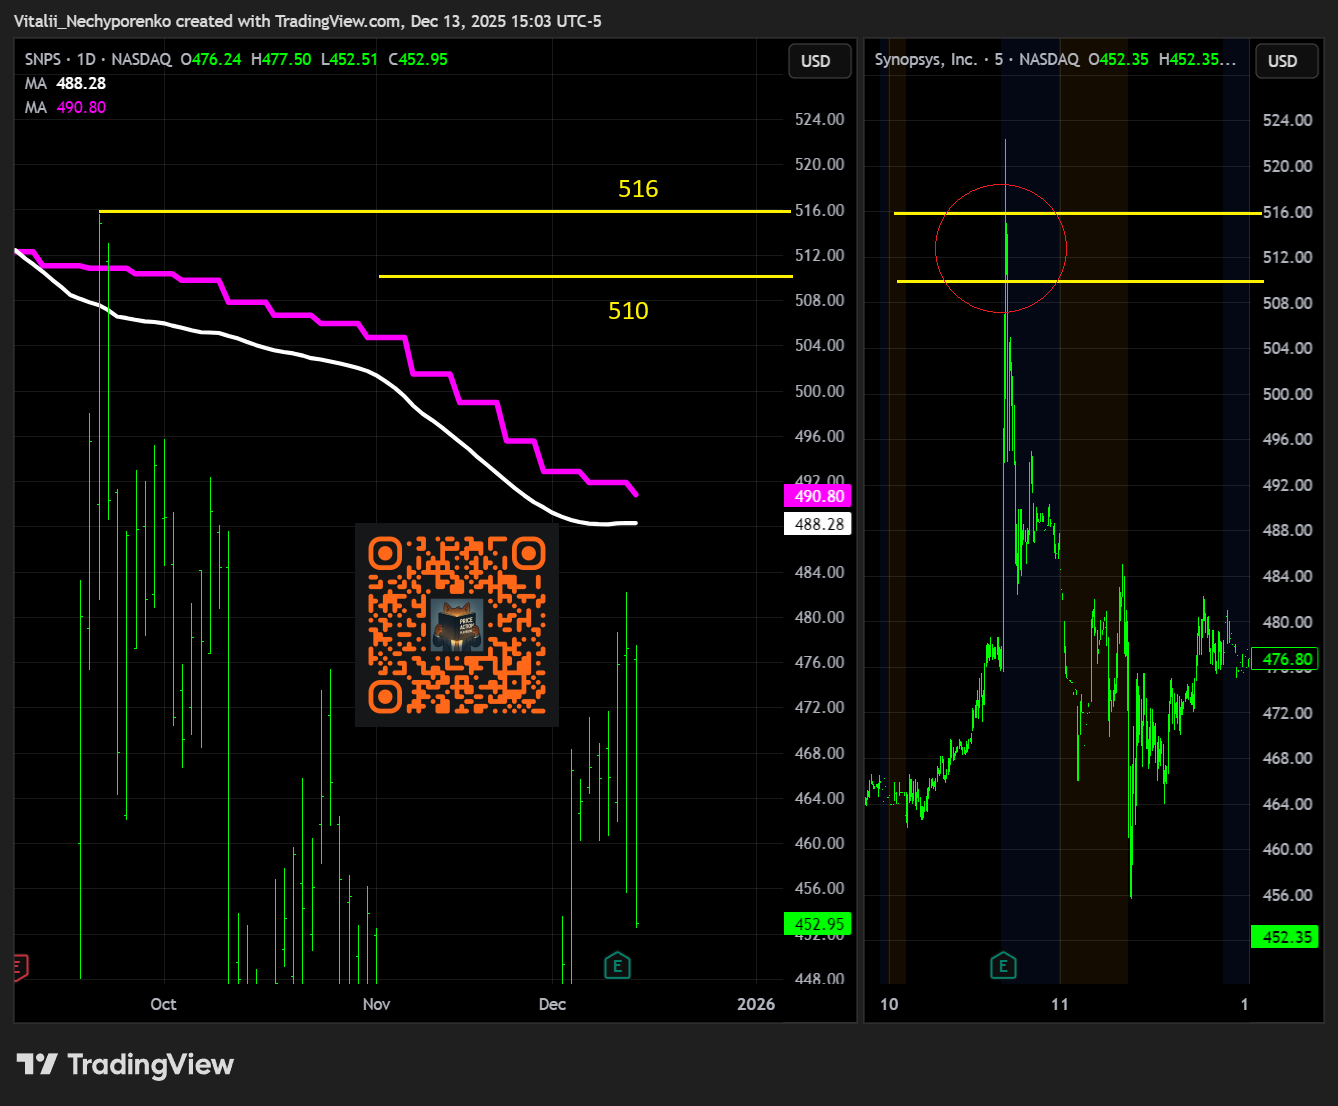
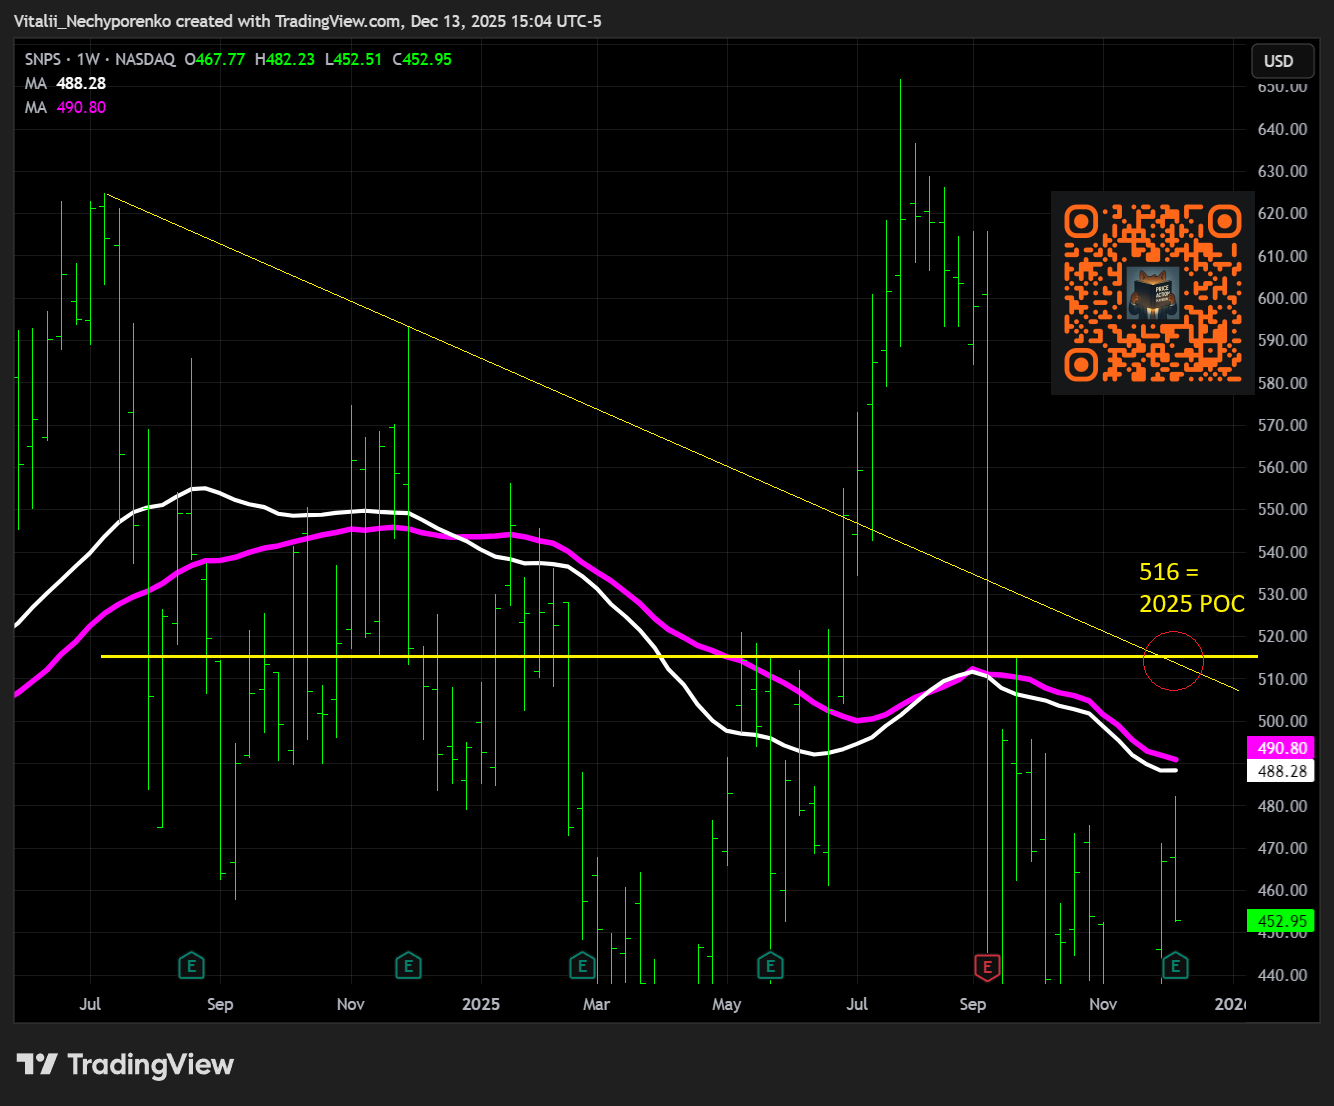
I was highlighting 502 and 516 as the key resistance levels last week, though I slightly adjusted the first one to 510 in the pre earnings note. Here is the big picture to show the logic behind the highlighted area:
The stock was clearly rejected at the mentioned area, which led to a full gap fill and continuation beyond it in the following session. Numbers matter, but when there is not enough demand in an area loaded with supply, we all know what happens.
LULU
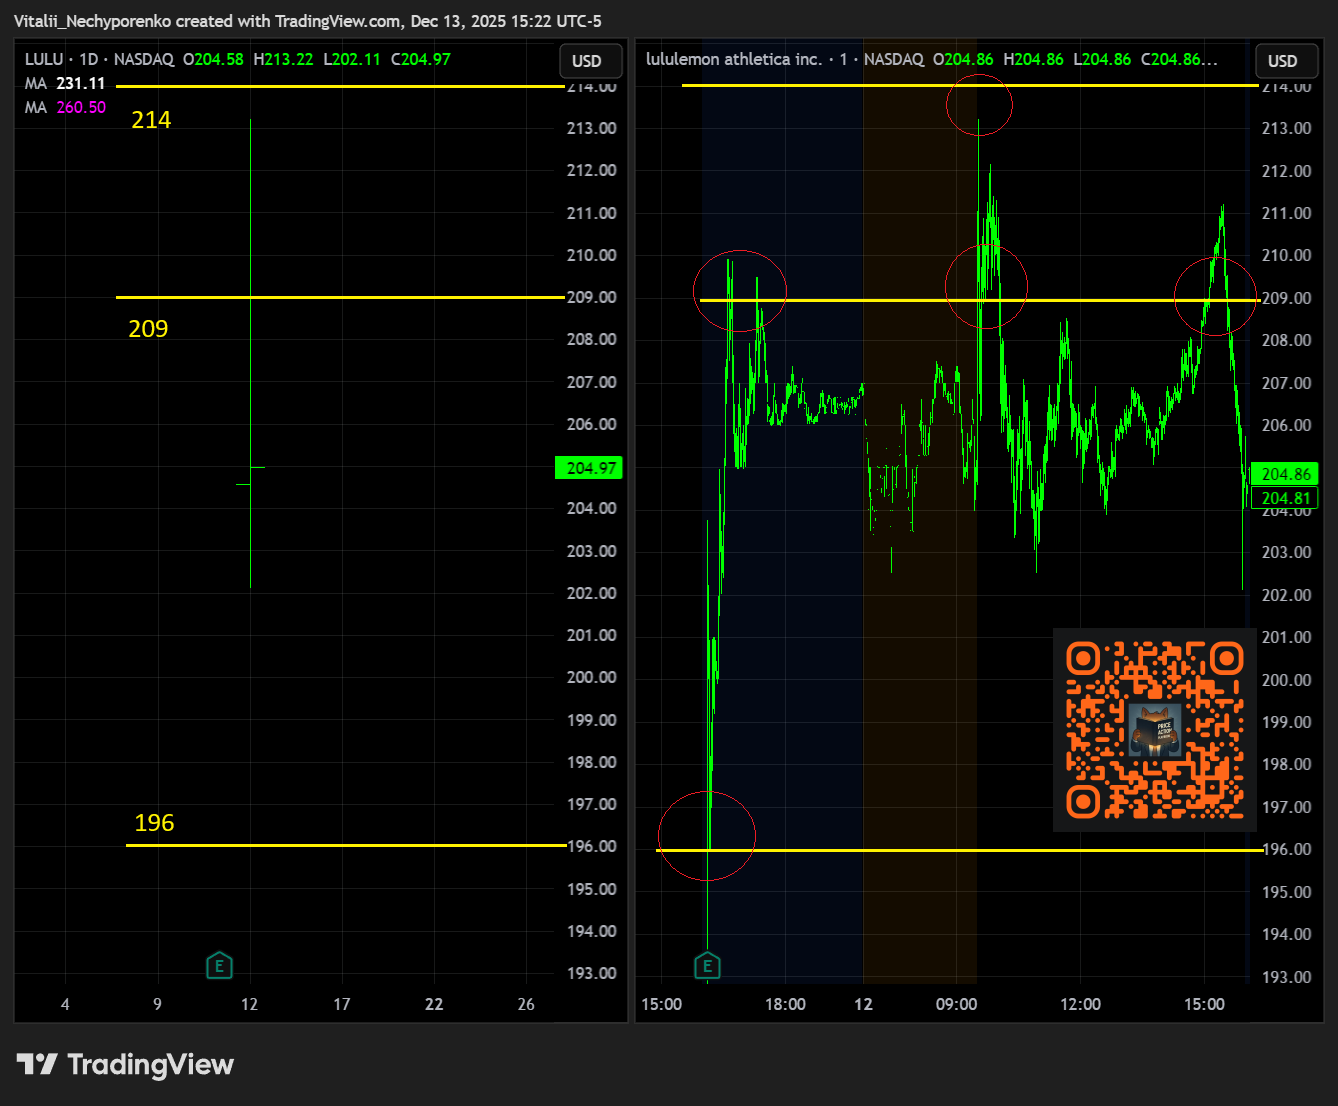
lululemon reported a Q3 beat on both revenue and EPS, with revenue up 7.1% yr over yr to $2.57 bln, supported by steady international growth that offset continued weakness in the U.S. Comparable sales rose 1% overall, with U.S. comps down 5% while international comps accelerated to 18%, led by China where revenue grew 46%. Margin pressure persisted, with gross margin down 290 bps to 55.6% due to tariffs and elevated markdowns, and Q4 guidance reflected that strain with EPS below consensus on in line revenue. Management also announced a CEO transition effective January 31 and increased its share repurchase authorization by $1 bln, while reiterating that a more meaningful product refresh and growth inflection is expected in 2026 rather than near term.
Last week I was highlighting 209 and 214 as the key resistance levels, though I added 196 in the pre earnings note as well. The weekly trendline at 196 is fairly old and does not fit well on a zoomed out chart, while the other two areas are quite simple but no less important. Here is the big picture:
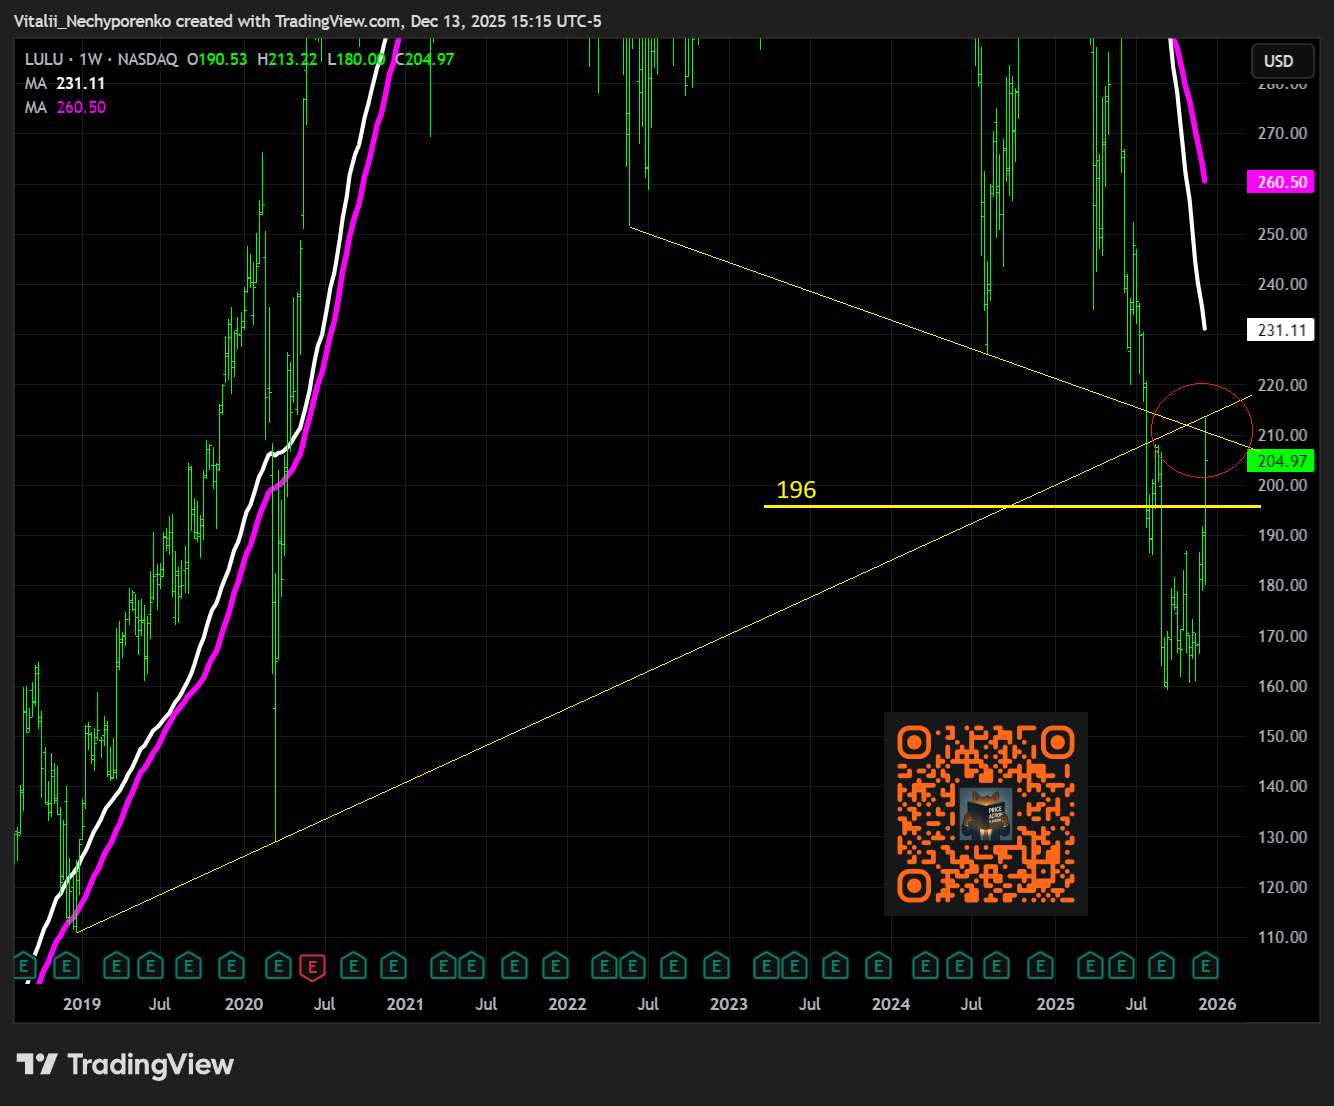
The stock flipped 196 in aftermarket trading with a couple of clean backtests and then ripped higher. It topped out frontrunning the 214 on Friday and had a hard time holding above 209. Despite another attempt to push toward the high of day late in the session, it failed. It is worth watching whether it tries to consolidate in the following sessions for any follow through, though 196 should hold for now for this kind of setup.
AVGO
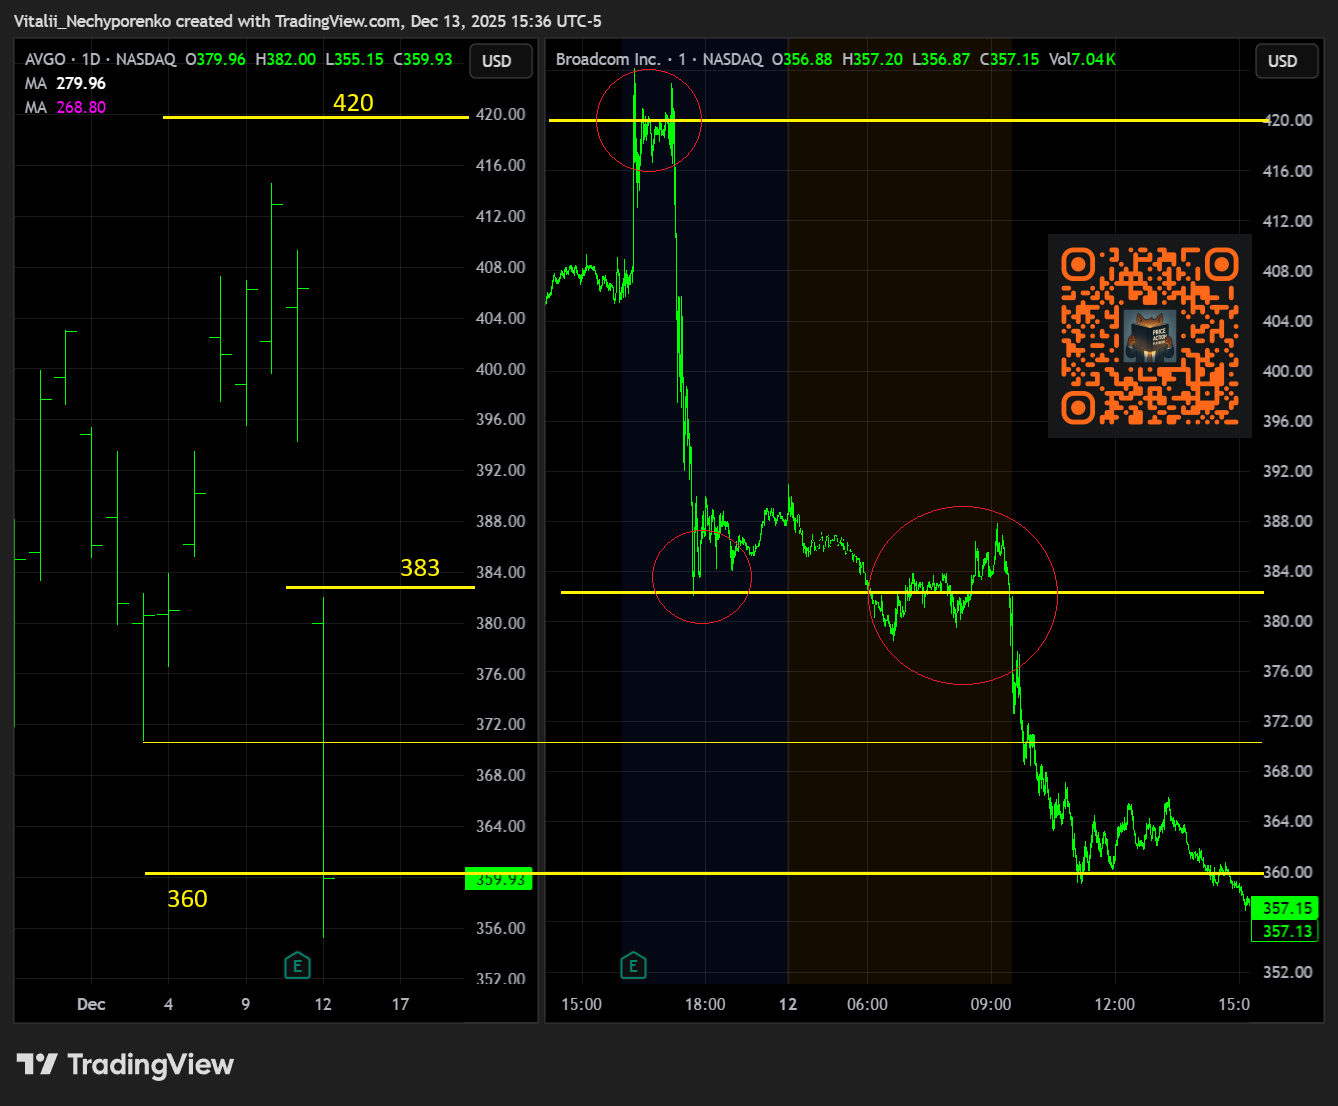
Broadcom closed FY25 with strong upside results, guiding Q1 revenue above consensus and raising its dividend by 10%, driven by continued acceleration in AI related demand. The semiconductor solutions segment delivered Q4 revenue of $11.1 bln, up 35% yr over yr, with AI semiconductor revenue rising 74% to $6.5 bln as custom accelerator and networking demand expanded. Management guided Q1 semiconductor revenue to $12.3 bln, up 50% yr over yr, with AI semiconductor revenue expected to reach $8.2 bln, or 100% growth, supported by XPUs and Ethernet switching for large scale AI deployments. Infrastructure software revenue rose 19% to $6.9 bln, with contract bookings increasing to $10.4 bln, and FY26 commentary pointed to continued AI driven growth alongside stable non AI semiconductor demand and low double digit software growth led by VMware.
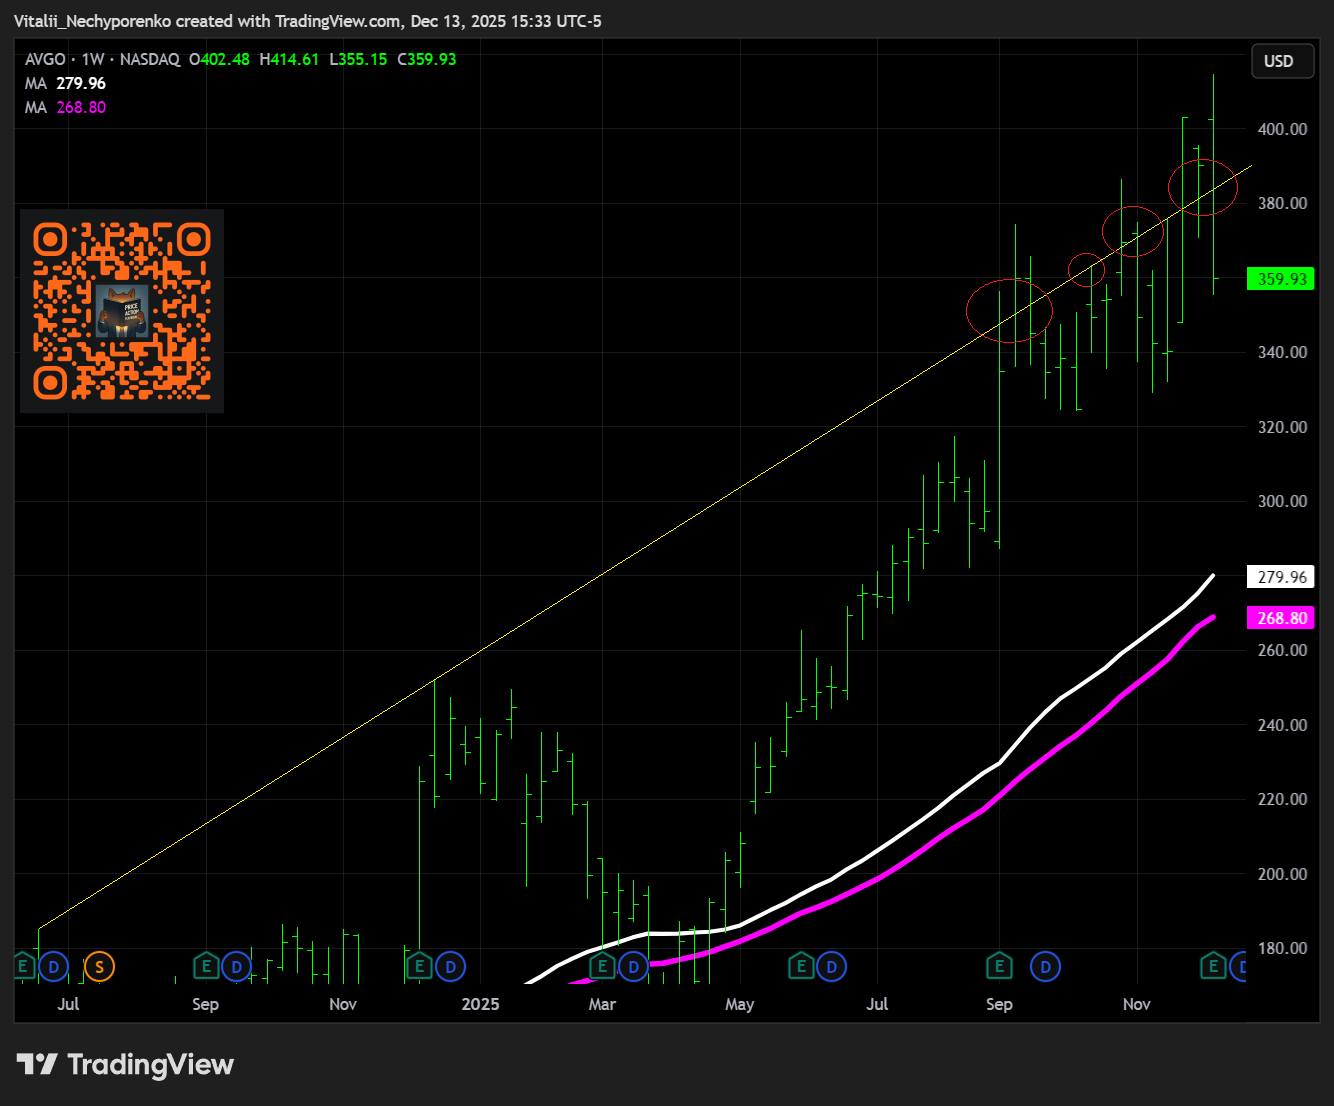
In the last Weekly Playbook I was highlighting 416.5 to 428.5 as key resistance levels, though I shifted focus to 420 to 450 given the proximity to the first area. Not the worst choice, I guess. The stock was clearly rejected at 420, and as we all know 420 is not meant to be rejected😁. Jokes aside, there was an attempt to reclaim the level right as the conference hit, which added fuel to the move.
In the Premarket Price Action Snapshot the following day I wrote, “If it cannot hold above 383, the first support at 370.5 is to watch.” While 370.5 marks the local pivot low, here is the logic behind 383:
The area broke down right before the open with a slight help from the Nasdaq opening imbalance. The 370.5 level did not provide meaningful support, aside from offering another low risk entry point. You all know what followed. I would just note the close right at the previously mentioned first support area of 360 from the last weekly writeup. Let’s see what happens next, but a breakdown of the earnings low could take us much lower from here, that is for sure.
5. Earnings to Watch This Week
In this section I share the clean charts highlighting only key zones used for planning and execution. I use fully layered charts to identify them, but keep the charts here clean for clarity. All levels reflect Friday’s close, though much can change between Monday’s open and the actual earnings release. If a key support or resistance zone is reached or broken beforehand, I’ll shift to the next level and update accordingly. Those updates often go out without charts, either in the morning note or the pre-EPS AMC note, and I base my execution on the revised levels. So if you notice differences between the weekend write-up and later updates, that’s intentional.
Wednesday
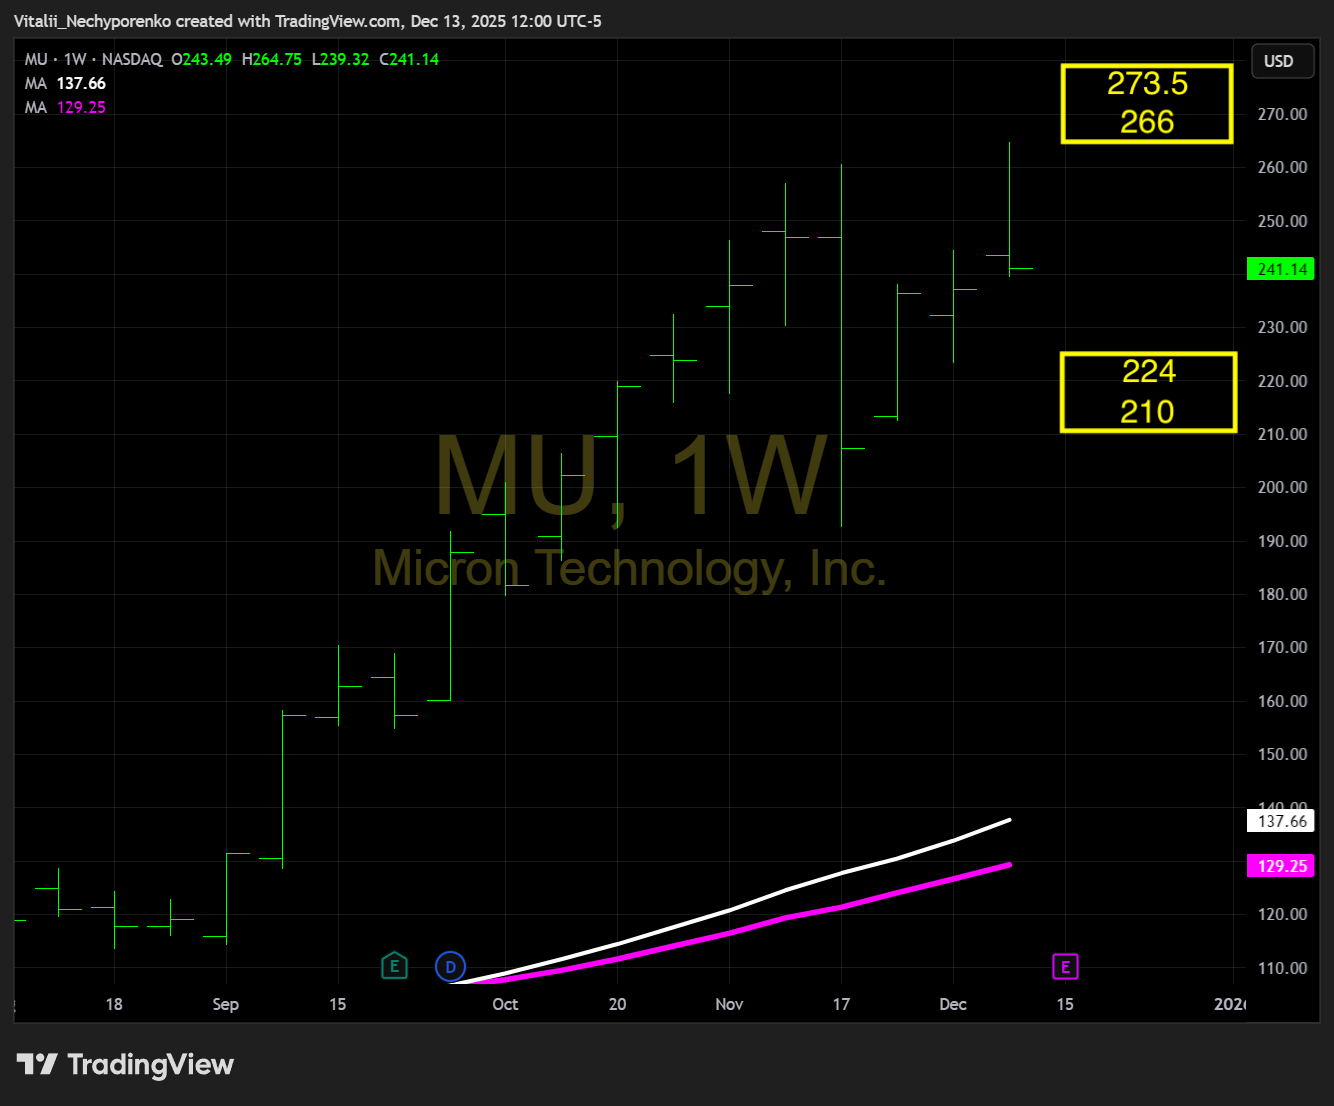
MU After Market Close
Turnover: $6.0 billion
Support: $210-224 (Projected move to support: -7.11%)
Resistance: $266-273.5 (Projected move to resistance: +10.31%)
Thursday
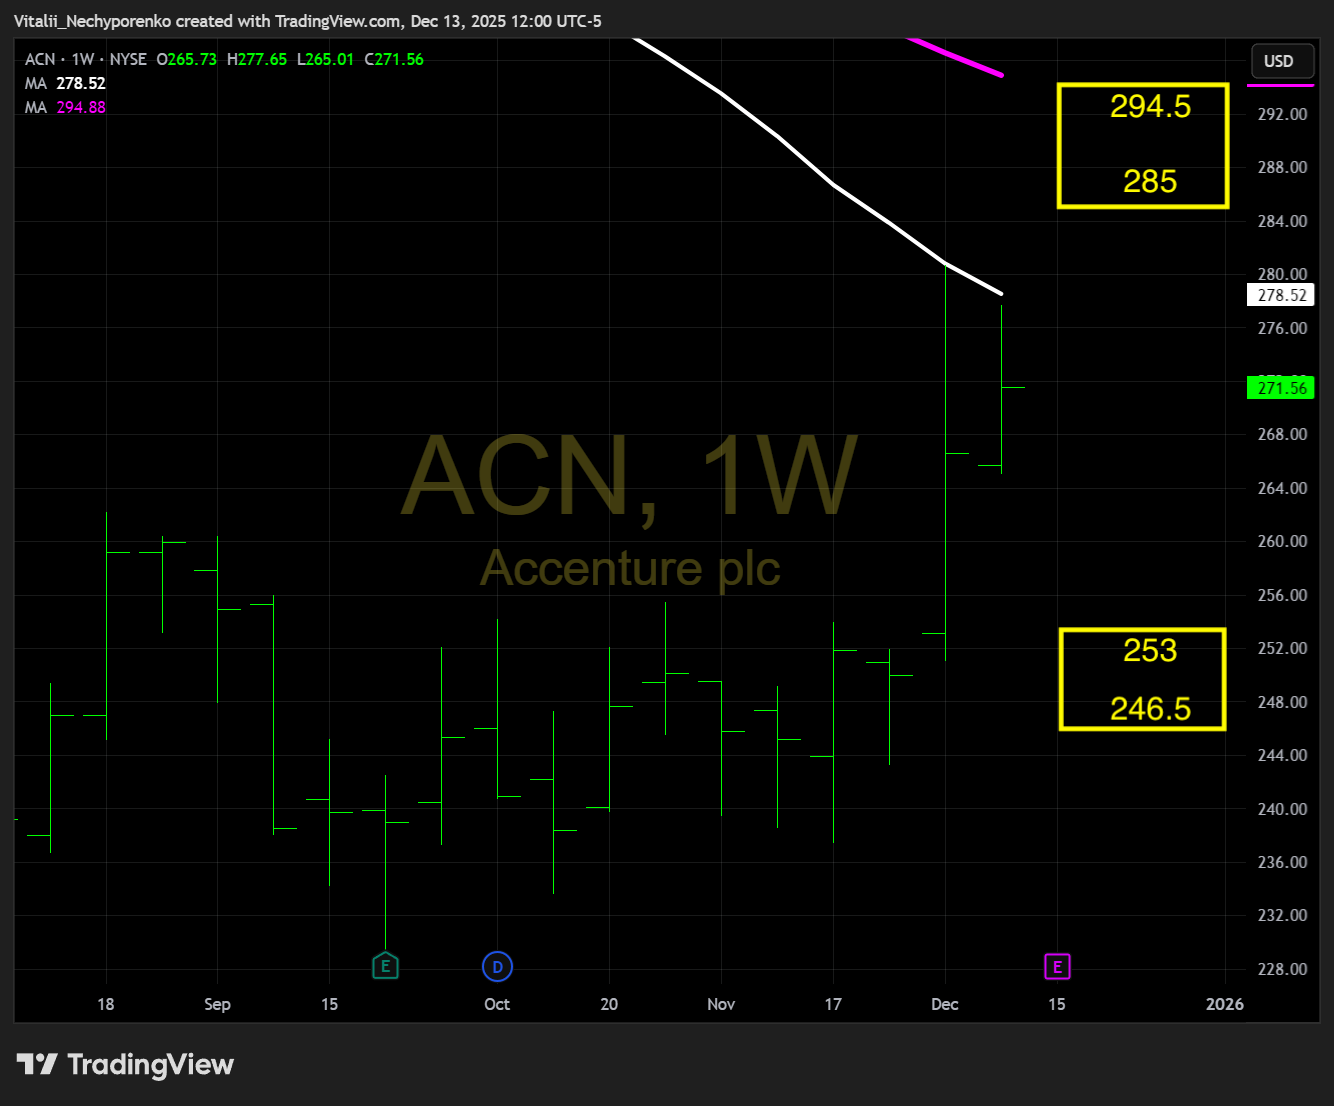
ACN Before Market Open
Turnover: $1.0 billion
Support: $246.5-253 (Projected move to support: -6.83%)
Resistance: $285-294.5 (Projected move to resistance: +4.95%)
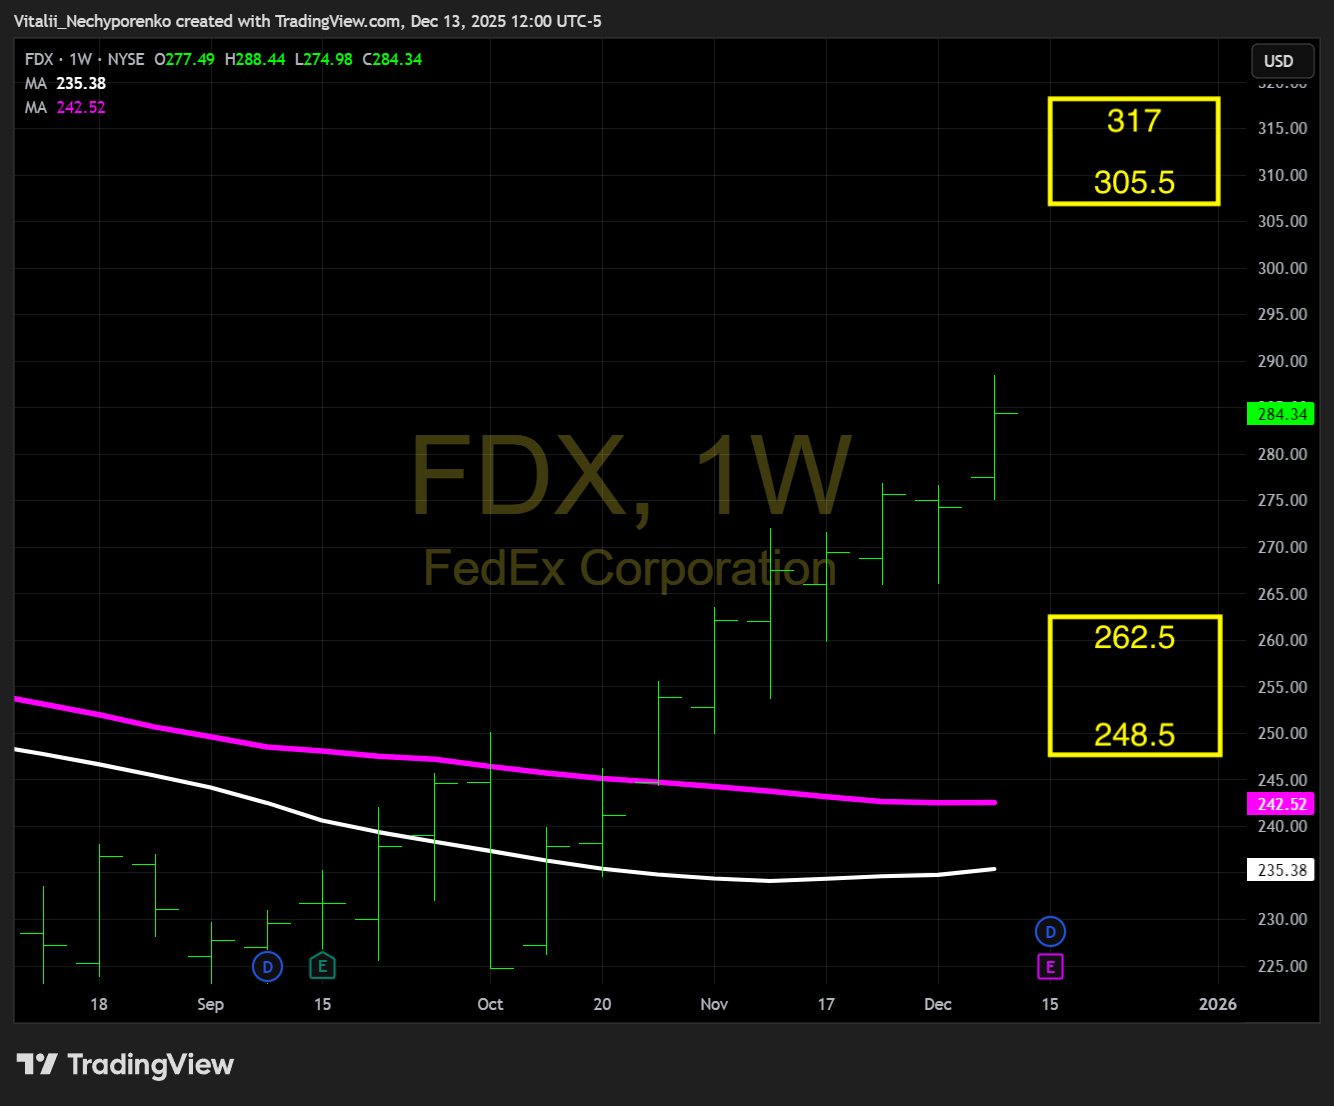
FDX After Market Close
Turnover: $0.5 billion
Support: $248.5-262.5 (Projected move to support: -7.68%)
Resistance: $305.5-317 (Projected move to resistance: +7.44%)
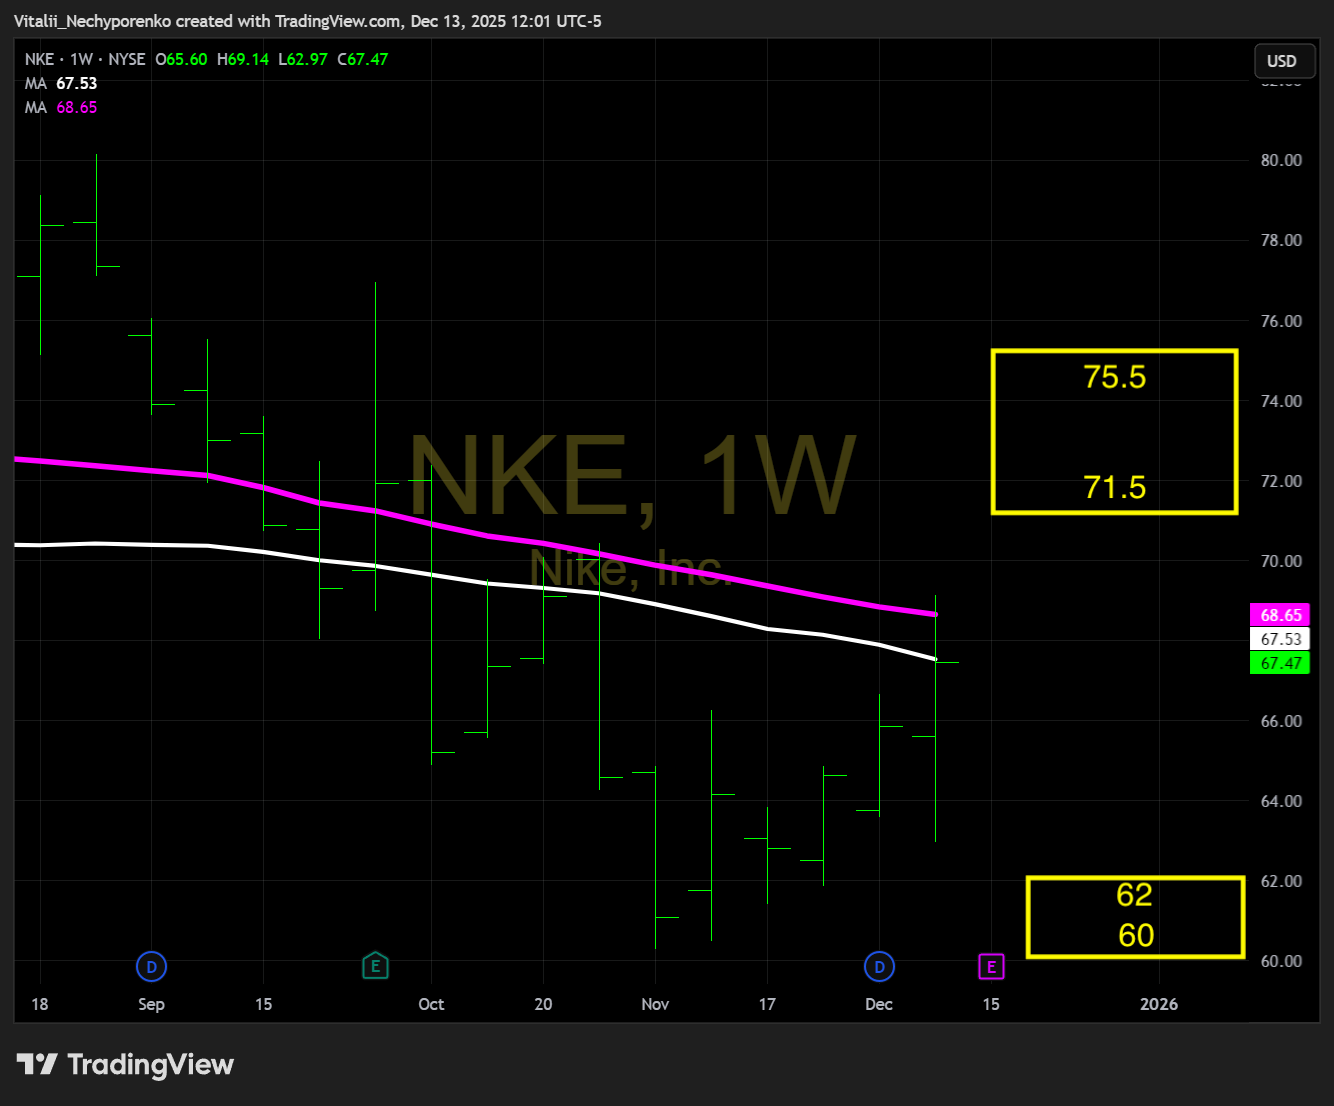
NKE After Market Close
Turnover: $1.0 billion
Support: $60-62 (Projected move to support: -8.11%)
Resistance: $71.5-75.5 (Projected move to resistance: +5.97%)
Disclaimer:
This report is intended solely for informational and educational purposes and reflects independent commentary and analysis by the author. The author is not affiliated with any company mentioned in this report and holds no positions on the board of any related entities. All opinions, analyses, and insights expressed are the author’s alone and should not be interpreted as specific investment advice, a solicitation to buy or sell securities, or an endorsement of any particular investment strategy.The information provided is derived from sources and research the author deems reliable, but its accuracy, completeness, or timeliness is not guaranteed. Readers should not rely on this report as the sole basis for any financial decisions. The author disclaims any liability to update or revise the content as new information becomes available.
Investing involves significant risks, including the potential for loss of principal. Past performance does not guarantee future results. Investments or strategies discussed may not suit every individual’s circumstances, and they may fluctuate in price or value. This report does not consider your specific financial objectives, risk tolerance, or personal investment needs. Readers are encouraged to conduct their own research and consult with a qualified financial or investment advisor before making any investment decisions.
The author and any associated entities do not guarantee specific outcomes or profits from the use of this report. The author may or may not hold open positions in the securities mentioned. By reading this report, you acknowledge the risks involved and accept the limitations of the information presented.